When you implement something in Google Analytics (or any other platform), never trust your gut. Always verify that the data was actually received by the platform and is displayed in reports the way you expect it.
In Universal Analytics, this was done by checking real-time reports (to verify events, conversions, page views). But if you wanted to debug things like Enhanced Ecommerce, you had to wait until the data lands in the standard reports. This means hours of delay between the configuration and the actual debugging.
Luckily, that has changed in GA4 with a new feature called DebugView (I mean, it’s new if we compare to Universal Analytics). DebugView in Google Analytics 4 allows checking the incoming data at a more granular level (without the need to wait for hours).
Table of Contents
+ Hide table of contents +
- Video Tutorial
- Where can you find DebugView?
- 3 ways to enable DebugView (for websites)
- Overview of the DebugView Interface
- Using the DebugView
- Final Words
Video
If you prefer video content, here’s a quick tutorial/overview on my Youtube channel.
Where can you find DebugView in Google Analytics 4?
First, let’s start with the very basics. You can find it at the bottom left corner of your GA4 interface. Click it.
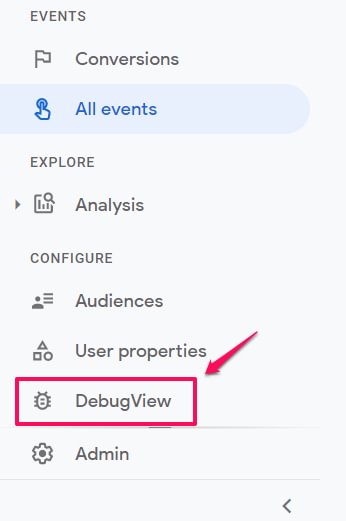
That’s the place where your debugging should take the place. Do not mix this with the GTM Preview and Debug mode. They are two different beasts.
Google Tag Manager Preview mode is designed to debug tags that are stored in a GTM container (Universal Analytics, Google Analytics 4, Google Ads, Facebook Pixel, etc.). Google Analytics 4 DebugView is designed to view the incoming data in your GA4 property (and only that).
Once you go to the DebugView, most likely, you won’t see any data there (because it displays only those events that contain a special “debug” parameter). In other words, you need to enable the DebugView in your GA4 event tracking in order to start seeing something.
In the next chapter, we’ll learn how to do that.
3 ways to enable DebugView in Google Analytics 4 (for websites)
To enable the DebugView in GA4, you have several options for websites (any of them will work):
- Enable the GA debugger Chrome extension
- Have enabled Google Tag Manager’s Preview mode on a page that you’re debugging
- Send a debug_mode parameter together with an event
If you want to learn how to enable the DebugView on mobile apps, please refer to this page.
#1. GA Debugger Chrome Extension
Your first option is to install the extension here. Once you do that, then click the extension’s icon (so that you can see the ON ribbon).
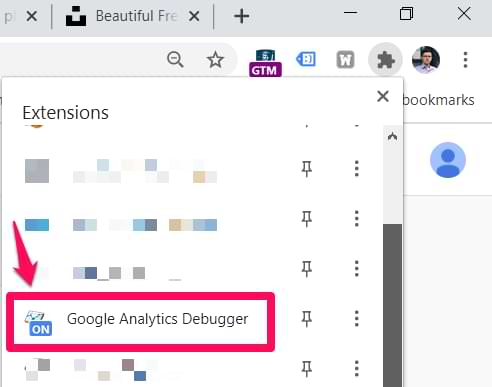
From this moment, start interacting with the website, and eventually, you will see your events coming into the DebugView.
Why does this happen? When the Debugger extension is installed and activated, it checks all the requests sent to Google Analytics 4 and adds an additional parameter needed for the DebugView to display the data. That parameter is _dbg:

#2. GTM Preview mode automatically makes the data visible in the DebugView
If you have implemented GA4 with Google Tag Manager and are currently debugging the setup with Preview and Debug mode, then there is nothing else you need to do. Just like the GA Debugger Chrome extension, the GTM Preview mode adds an additional parameter that instructs Google Analytics 4 to display that incoming data (from your browser) in the Debug View.
#3. debug_mode event parameter
If you want to make the data visible in the DebugView even while the GTM Preview mode is disabled (and you don’t want to install the browser extension), you can add the debug_mode parameter to the events. To enable the parameter, you have to add the debug_mode to the GA4 tag and then enter any value (but “true” without quotation marks makes the most sense).
You have two choices where to include the debug_mode parameter:
- In the GA4 configuration tag (then all the other events tags that are using it will also inherit the parameter)
- Or only in certain GA4 event tags. In that case, the debug_mode parameter will be applied only to those tags and only those particular events will be displayed in the DebugView of Google Analytics 4
Let me show you how to do that with the GA4 Configuration Tag.
In Google Tag Manager, you can do that by opening the GA4 Configuration tag and adding the following parameter:
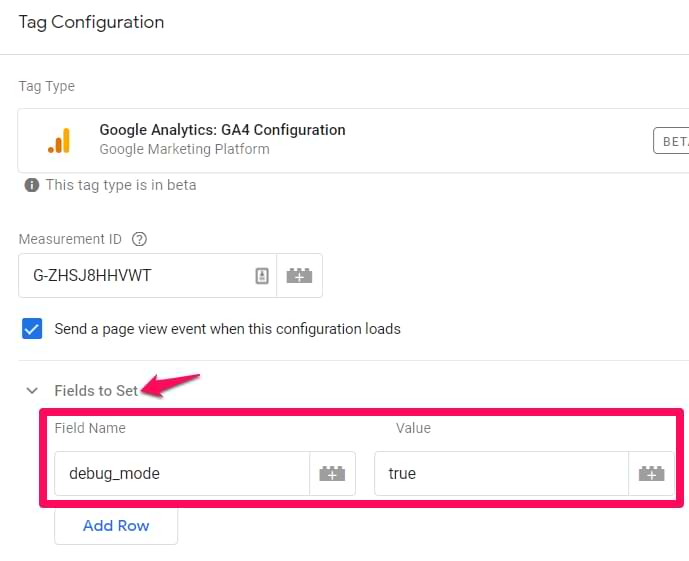
If the debug_mode parameter is set to true, the event will be seen in DebugView. If you are using a hardcoded gtag.js, here are the instructions on how to include the debug_mode parameter.
And that’s it. Once you enable the DebugView (by choosing one of the options above), you can go to GA4 > DebugView and see what is happening there.
Overview of the DebugView Interface
The UI of the DebugView can be split into several sections:
- Minutes stream
- Seconds stream
- Top Events
- User Properties
- Device Selector
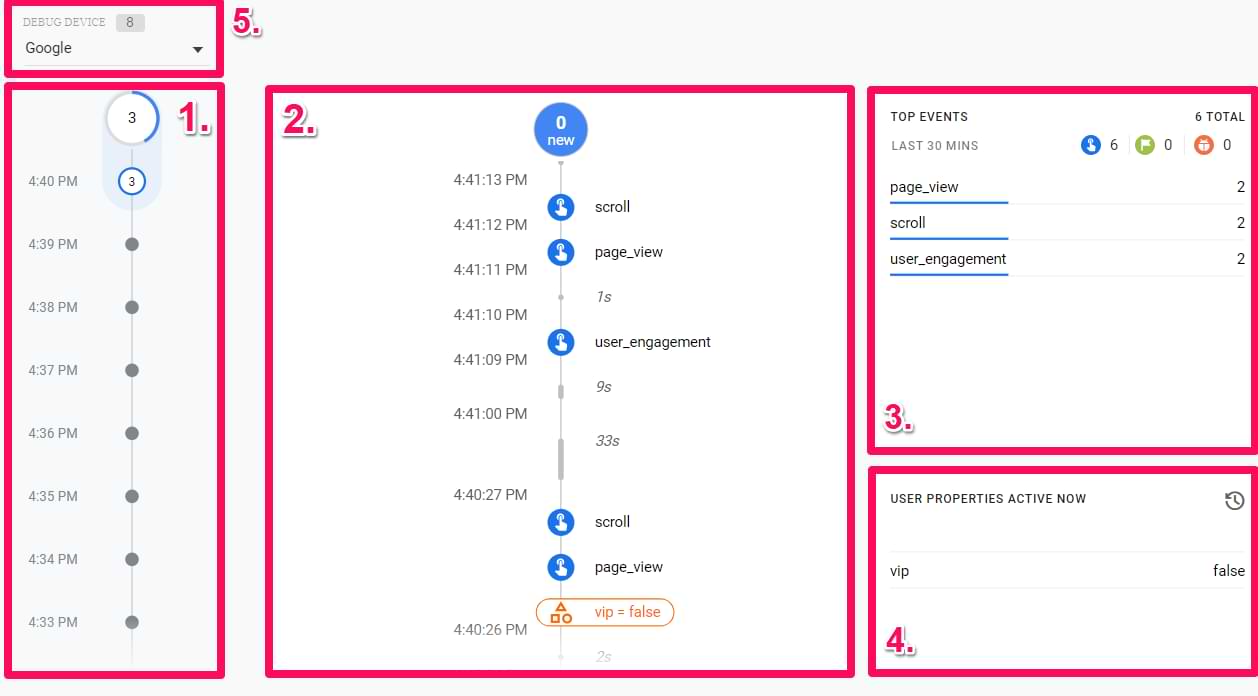
Universal Analytics realtime reports display the data of users who have been active in the last 5 minutes. But things are different with the GA4 DebugView. Here you will see the data for the last 30 minutes.
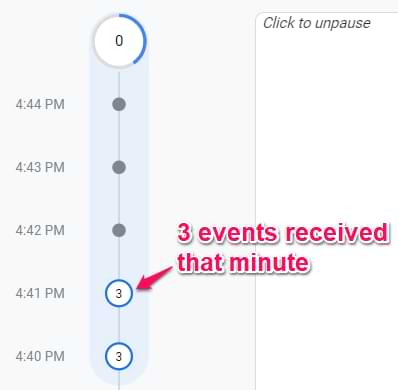
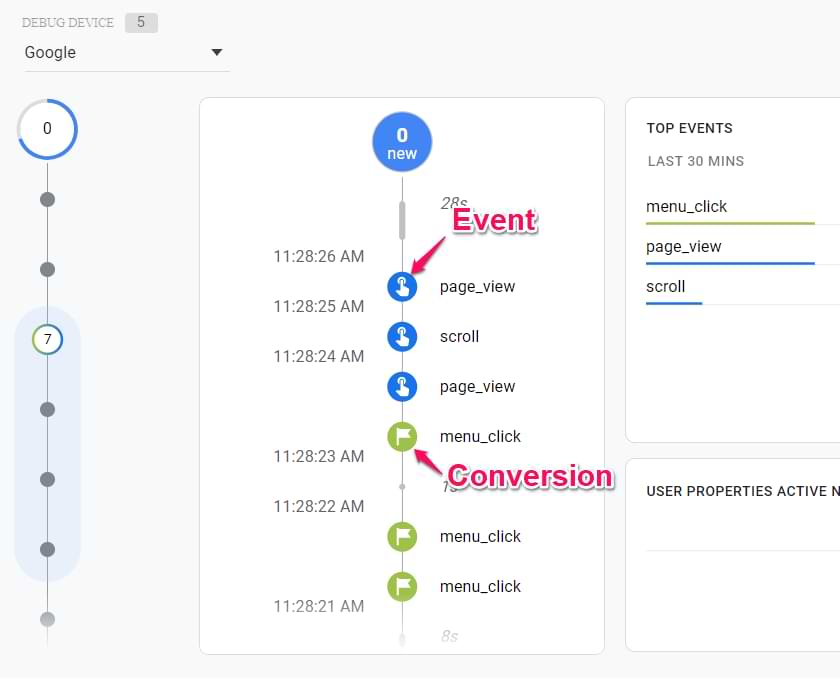
#1. Minutes stream (on the left side of the DebugView) shows a series of circles, one circle for each of the most recent 30 minutes. The number in the circle indicates the count of events received in that minute. Clicking on one of these circles populates the Seconds stream with events that were logged during that minute of time. This allows you to examine the events logged over the last 30 minutes in greater detail.
#2. Seconds stream (middle column) is where the main action/debugging happens. Here you will see a list of events at a more granular level. Each event displays a timestamp that corresponds to the time of its logging on the development device. You can click an event to see a list of its parameters.
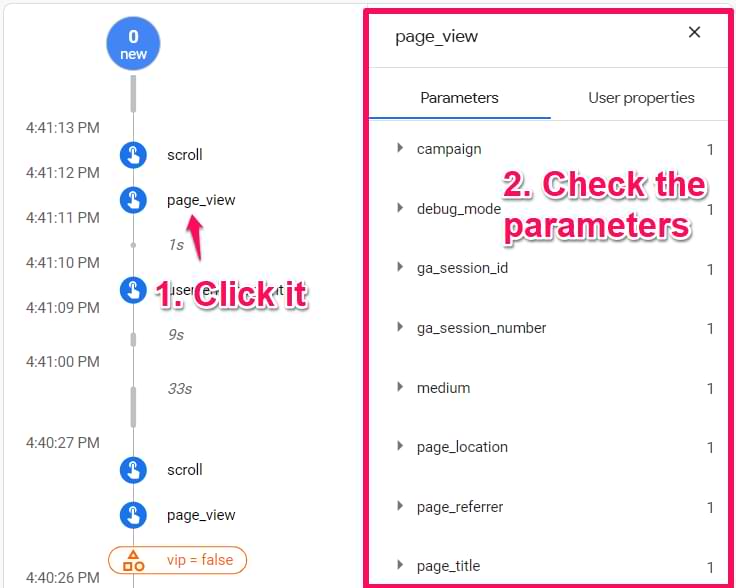
The Seconds stream is connected with other parts of the DebugView interface. For example, if you click a circle (with a number) in the Minutes stream, the Seconds stream will scroll down (or up) to the particular events of that minute.
#3. Top Events widget shows the top events that were logged during the 30-minute period.
- You can click on any of those events and it will work like a quick filter.
- Once you do that, you can choose a specific parameter…
- … and then you will see the timestamps of each parameter that was sent with that particular event in the last 30 minutes.
- Also, you can click on a particular timestamp and then see all the parameters of that event.
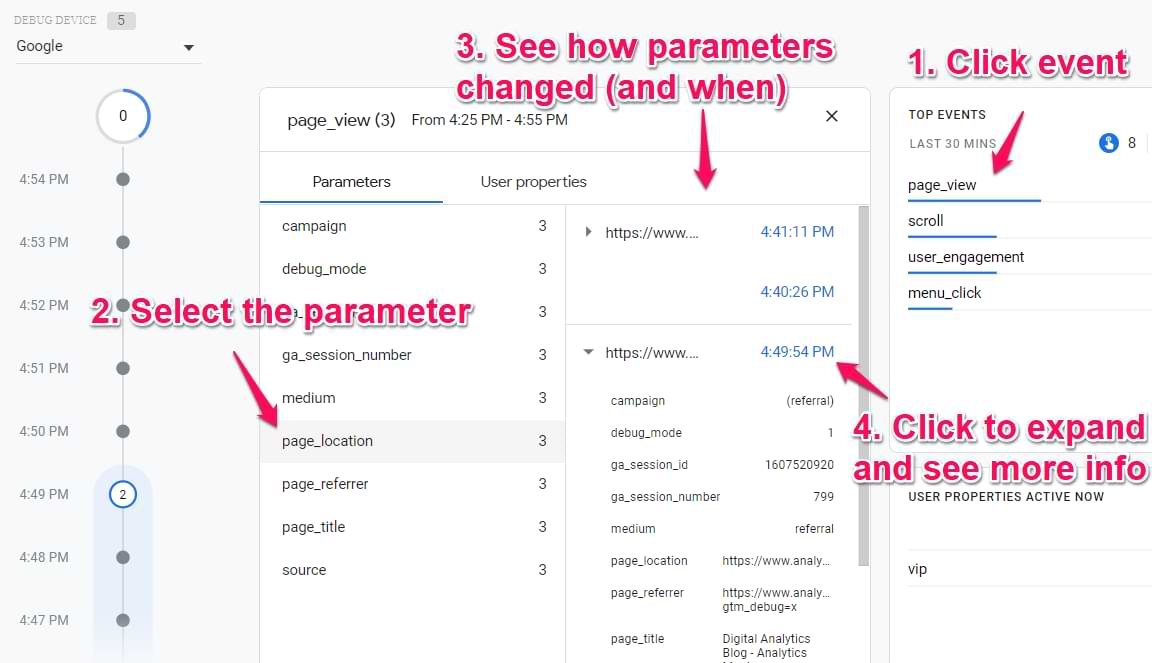
That is very useful to see how (and when) the parameter values changed with that event.
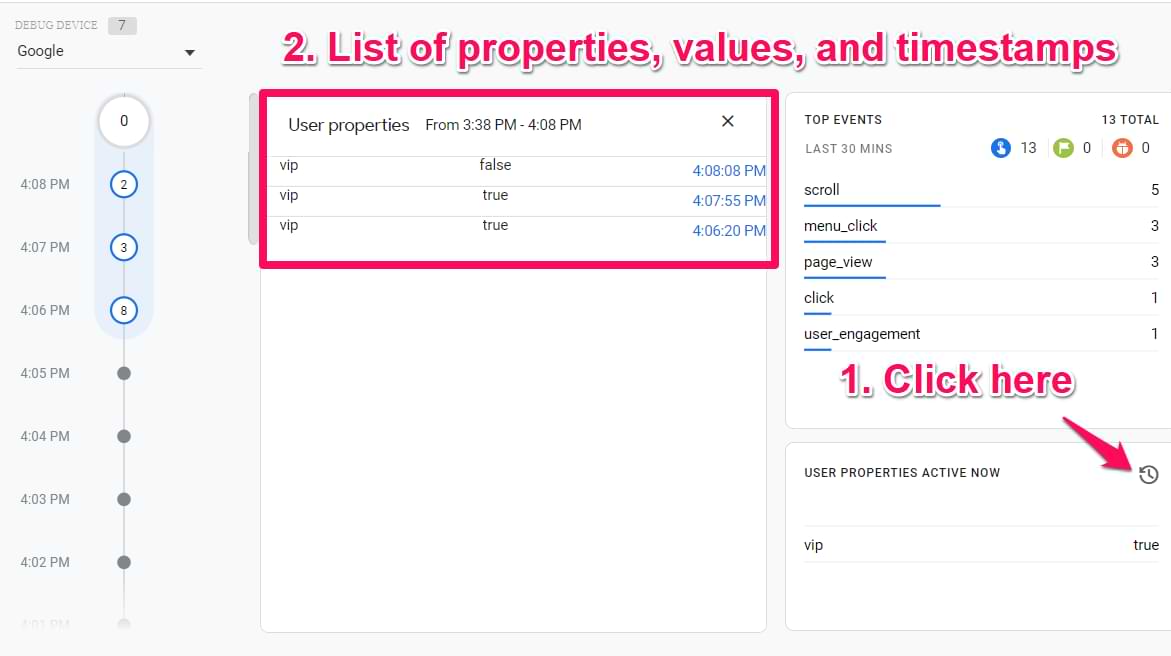
#4. User Properties shows the latest state of the set of User Properties for the currently selected device. You can click the little clock icon to see how values were changing in the last 30 minutes.
#5. Device Selector lets you select which particular device’s data you want to debug. The selector is located at the top left corner of the DebugView.
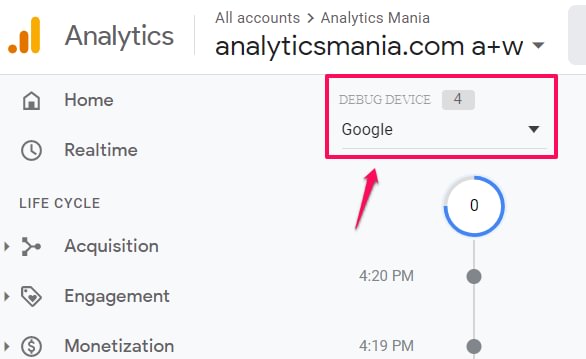
If multiple visitors have enabled the debug view (e.g. they all have enabled the Chrome extension), you will see multiple devices there and it might require some time to find yourself. This especially applies to my blog, when many of my readers have enabled the GA Debugger Extension and I have to guess which device (out of the other 10+) is mine 
Using the DebugView
When you start seeing data in the DebugView, you can click on every individual event and then a list of parameters will be displayed.
Click on that parameter to see the value that was received by GA4.
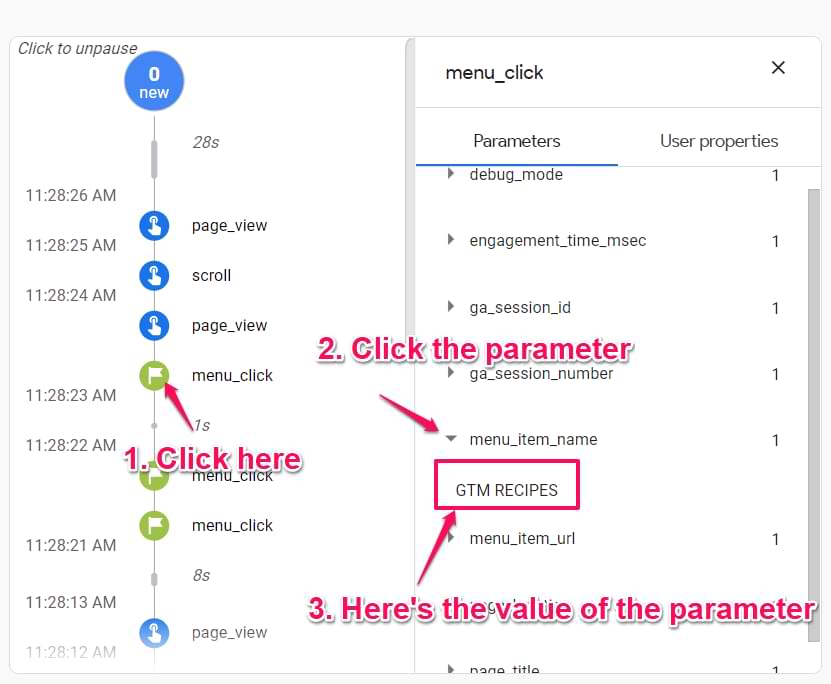
If you are getting a lot of events, you can click anywhere on the white background of the middle column (Seconds stream) and it will pause.
Blue icons represent events, green icons represent conversions, orange icons represent user properties.
NOTE: sometimes, it takes longer for the data to come in.
I have noticed some delays between the event actually happening on a website and then appearing in DebugView. Sometimes, I have to wait for several minutes until the events come in. That’s a bit unfortunate and hopefully, the team behind Google Analytics 4 will improve this in the future. But right now, please be patient.
DebugView in Google Analytics 4: Final Words
Hands down, this feature is amazing. After years of using previous versions of Google Analytics, it was really annoying to wait for the e-commerce data to appear in the reports in order to debug it. When I was sending some non-event, non-pageview, and non-goal data, I always had to waste my time.
Debugging is super important and now it has become a much quicker process when it comes to Google Analytics 4. This is a very welcome improvement in the Google Analytics space.