If you’ve ever used Google Analytics, Google Adwords, Google Tag Manager, or any other Google’s analytics/marketing tools, chances are that you’ve at least heard of Google Tag Assistant, or, most probably, even used it. That’s no surprise because it’s a really handy debugging tool!
Even though many of Analytics Mania’s readers use this Chrome’s extension, the majority of them do not reach its full potential. But that’s about to change because, in this Google Tag Assistant Tutorial, I’ll give you a bunch of tips on how to make you + Google Tag Assistant = super team.
Table of Contents
- What is Google Tag Assistant anyway?
- #1. How Does Google Tag Assistant Work?
- #2. Google Tag Assistant Colors
- #3. Session Recordings
- #4. Tag Assistant Report
- #5. Google Analytics Report
- #6. Replaces GA Debugger Extension
- #7. Favorite domains
- #8. Helps to troubleshoot Cross-domain Tracking Issues with ease
- #9. List of all checks
- #10. Other little handy features
- More Extensions for Google Tag Manager
- Google Tag Assistant Tutorial: Final words
What is Google Tag Assistant anyway?
First things first, let’s start this Google Tag Assistant tutorial with proper introduction.
Google Tag Assistant is a Chrome Extension that helps you validate the tracking code on your website and troubleshoot common problems and makes the entire process much easier and faster.
Tag Assistant enables you to record a typical user flow, it keeps track of all the hits you send, checks them for any problems, and gives you a full report of interactions. In case of any issues or potential improvements, it will let you know about them.
After you’ve installed the extension, a blue tag icon will appear in the top right corner.
![]()
#1. How Does Google Tag Assistant Work?
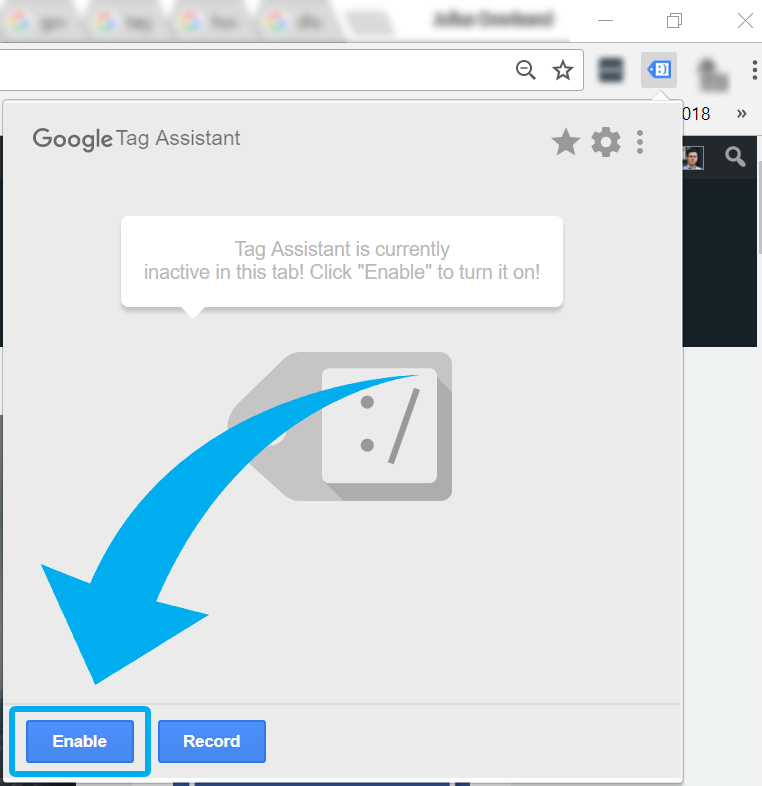
By default, Tag Assistant is in the “sleep mode”, meaning that it does not check anything that’s happening on a page. In order to activate it, click the blue tag icon and then Enable.
Now refresh the page. If any Google’s products are implemented on that page, you’ll start seeing a particular number within that blue tag icon which represents the count of tags found.
Click the blue icon again to see a detailed list of all found tags. Click any tag you want to get more details about, you’ll learn what data was passed, what could be improved, how many events were fired, etc.
Important note for beginners. “Tags” (that will be found by the Tag Assistant) will not the same ones that you have in the Google Tag Manager. In this case, a tag is a script of a Google Product that is implemented on a site. In fact, Google Tag Manager itself is also considered as a tag by the extension.
If you want to debug tags within Google Tag Manager and see their variables, triggers, etc., use GTM Preview and Debug mode.
#2. Google Tag Assistant Colors
Tag Assistant’s icon works like a litmus, its color changes according to the context. When Google Tag Assistant is enabled and the page is refreshed, the color of its icon can change to one of the following 4 options:
- Red
- Yellow
- Blue
- Green.

Red color means that at least one Google Tag (let’s say, Google Analytics) has a major issue that needs to be addressed as soon as possible. Click the red icon to find out more, what is the issue and how to fix it.
Yellow color means that at least one Google Tag has a minor issue and the issue should be addressed, otherwise you might face some tracking discrepancies.
Blue icon means that some non-standard implementation is found. While usually, such issues are not as serious as major (red) or minor (yellow) problems, you still might want to take a look at your implementation.
Green is the color you should be looking for, it means that all tags highlighted with green color are working perfectly.
Click the tag to see more details about it.

#3. Session Recordings
Another great, yet often underused feature is session recordings. Recording a flow produces a report of all hits that were sent via marketing tags. This lets you validate that a particular tracking tag on your site works as expected.
For example, if you own an e-commerce site, you could run through the pages and steps required to select an item, place the order, and submit payment. After the recording is complete, you can review all events/pageviews/etc. that were passed through and see what particular data was sent, what errors occurred, where they happened, etc.
To start recording a flow, click the Tag Assistant icon and then RECORD button.
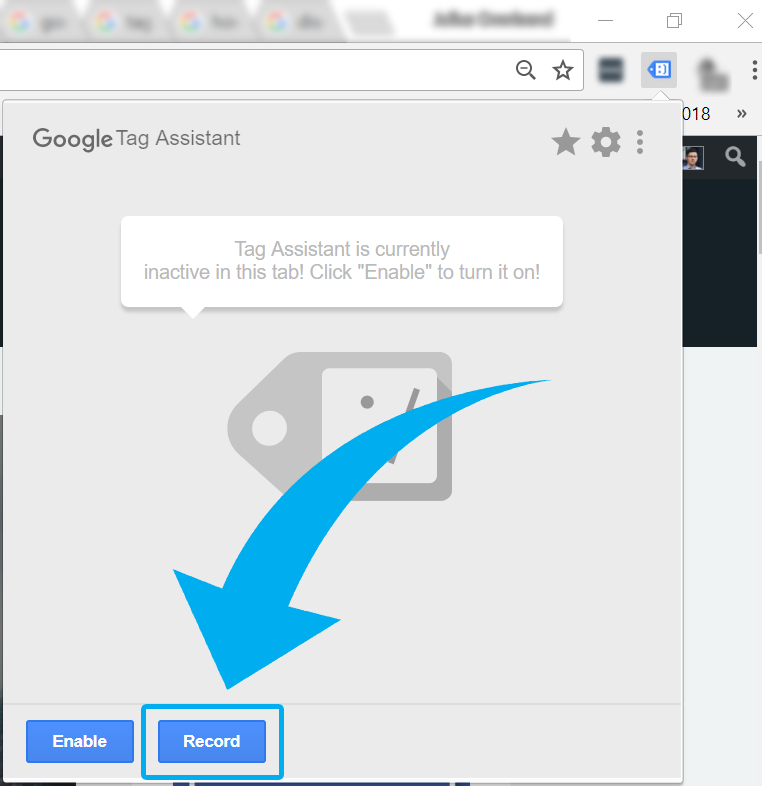
The actual recording will start after you refresh the page. During the entire session, a red dot will be attached to the blue tag icon. To stop recording, click the icon, the red STOP RECORDING button and the summary of the session will be displayed. Click Show Full Report.

#4. Tag Assistant Report
A full report will give you more insights on what happened during that recording session. Two types of reports are at your service:
- Tag Assistant Report.
- And Google Analytics Report.
The Tag Assistant report shows all the tags that fired on all the pages you visited during the recording session. The controls in the left-hand panel let you do the following:
- Filter tags
- Switch between detailed and basic views
- Show/hide ignored requests.
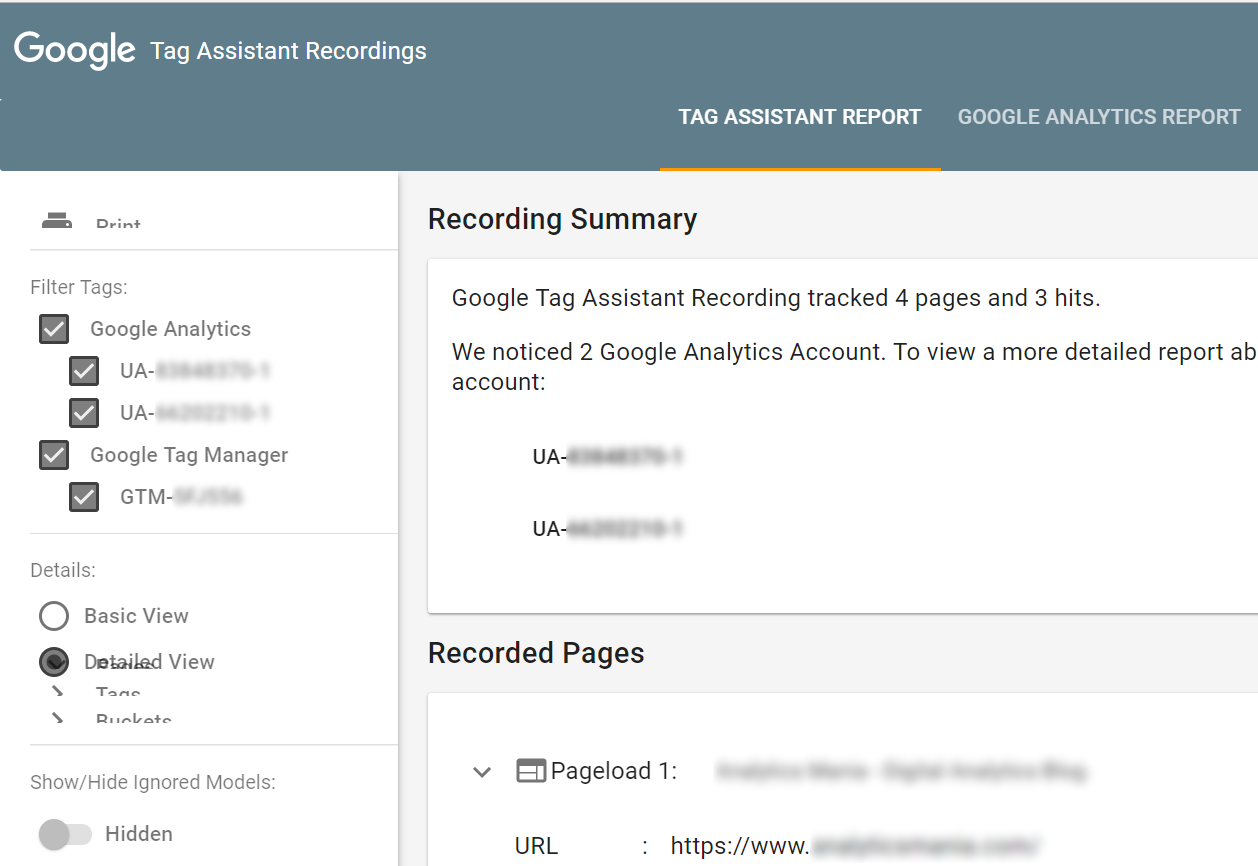
The main body of the page contains a Recording summary (of what happened during the session) and recorded pages. Click every page to expand its details and tags that were fired. Keep in mind that these tags are listed alphabetically (and not in their sequence).
As for the 2nd report (Google Analytics Report), I like it so much that I’ve dedicated a separate chapter in this blog post.
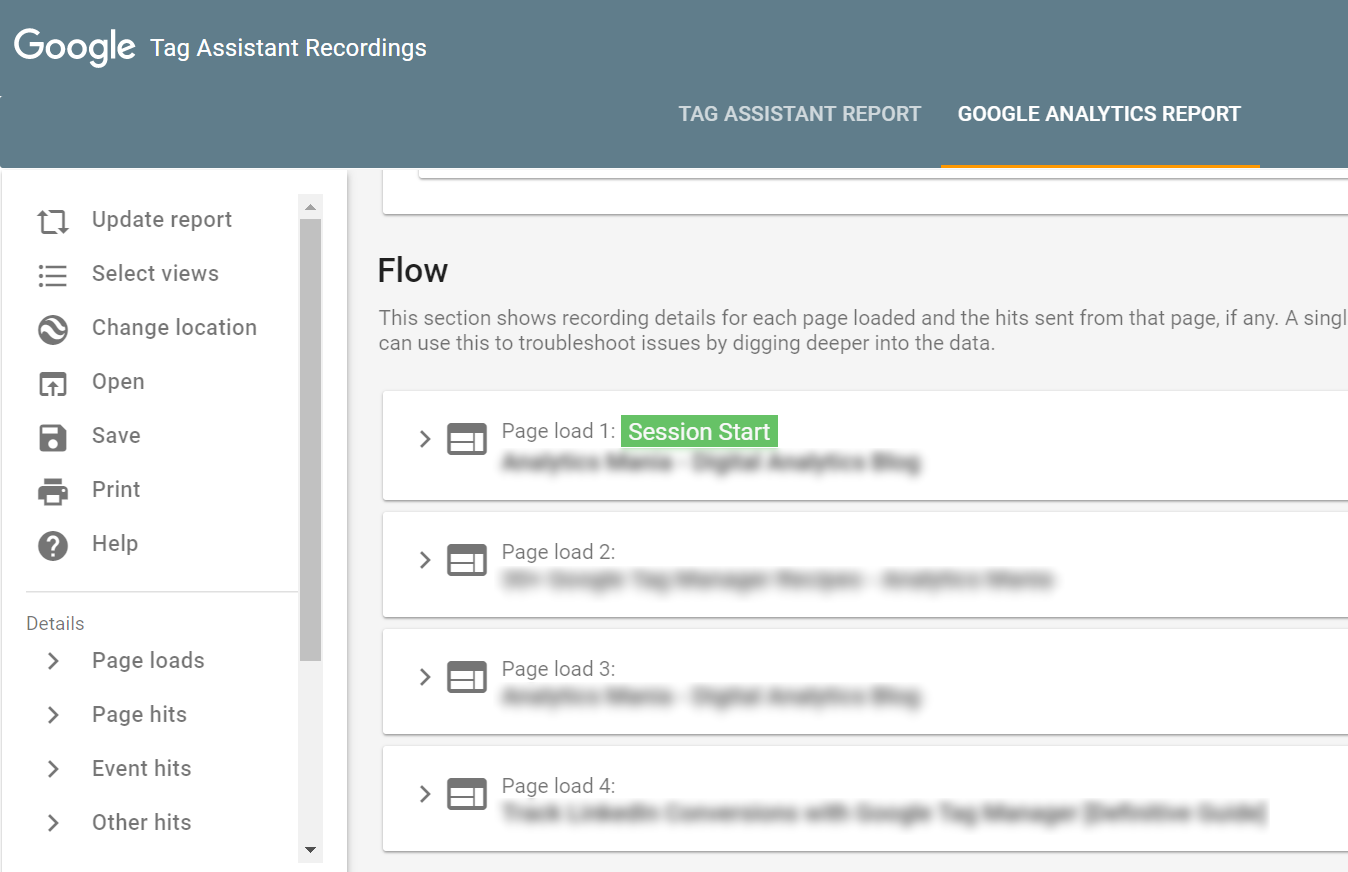
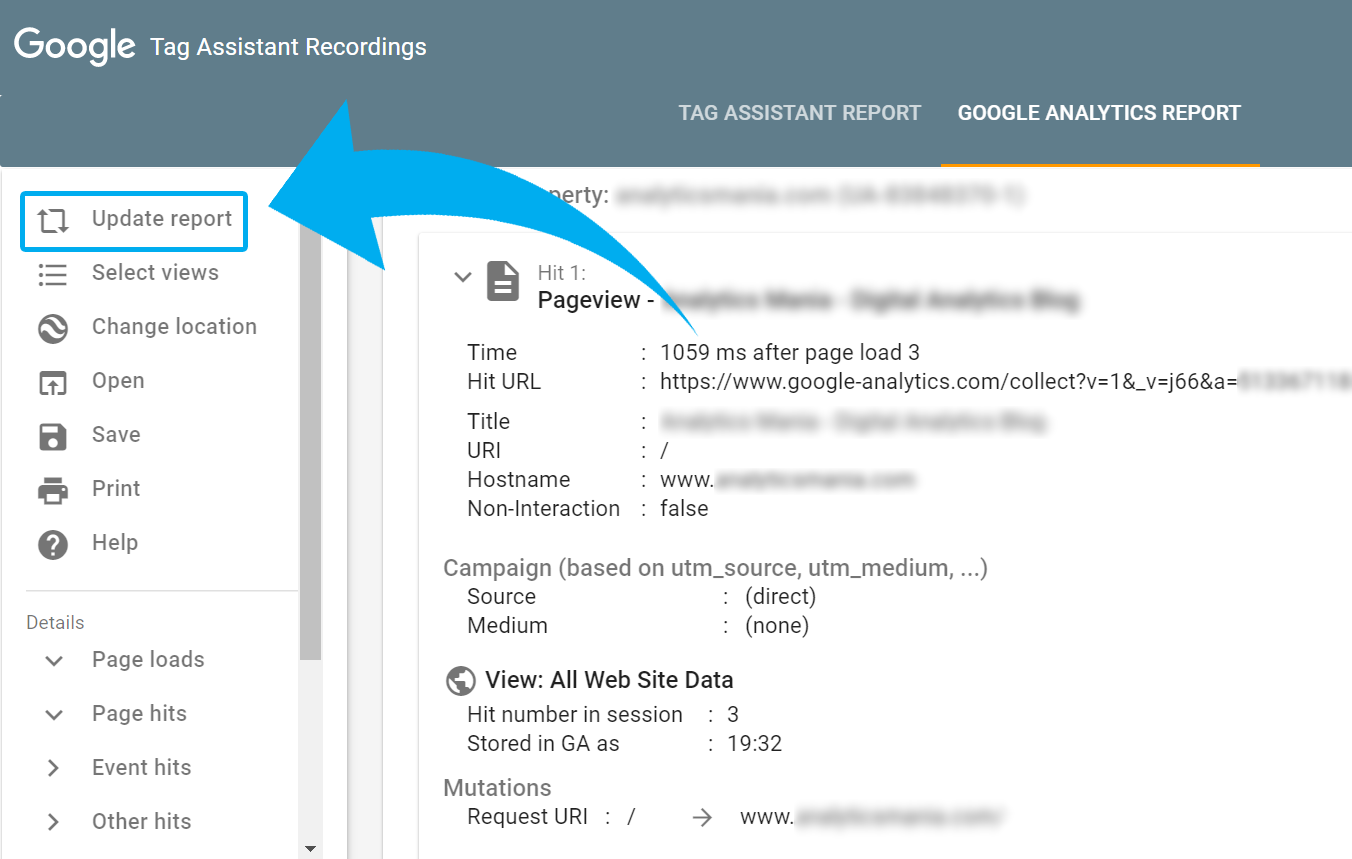
#5. Google Analytics Report
This report will show an emulation of how Google Analytics will process the hits. The tab will recognize the account ID for this site and will allow you to see the full report (if you have access to that account).
I tried to find the correct answer how does the plugin know which account do you have access to. Although I couldn’t find the 100% sure answer, here’s what I think: the plugin checks the email address that you’ve logged in with on Chrome and then checks what Google Analytics access does that account have. Let me know if you think I got this wrong.
Anyway, let’s get back to the report itself. In it, you’ll see multiple data points collected by Google Analytics including acquisition data, behavior data, and conversions data. If you notice some issue in the report that needs to be fixed in the GA account (say, you had to configure a Cross-domain tracking’s Referral Exclusion List in your Google Analytics account), feel free to do that.
After you’re done, just go back to the Google Tag Manager’s report and hit the Update report button in the top left corner. The plugin will check the entire recording session against your new GA Property settings and will let you know if the issue was fixed. That’s a real time saver!
You’ve reached the middle of the Google Tag Assistant guide. Good job! If you’re in a hurry, bookmark this guide and come back later. Otherwise, continue reading.
#6. Replaces GA Debugger Extension
One of the must-have Chrome extensions for a web analyst (or anyone else who’s verifying Google Analytics implementation) is GA Debugger. It’s a very useful plugin which reads all the requests that are sent from your website to Google’s servers and prints them in browser’s console in a readable format.
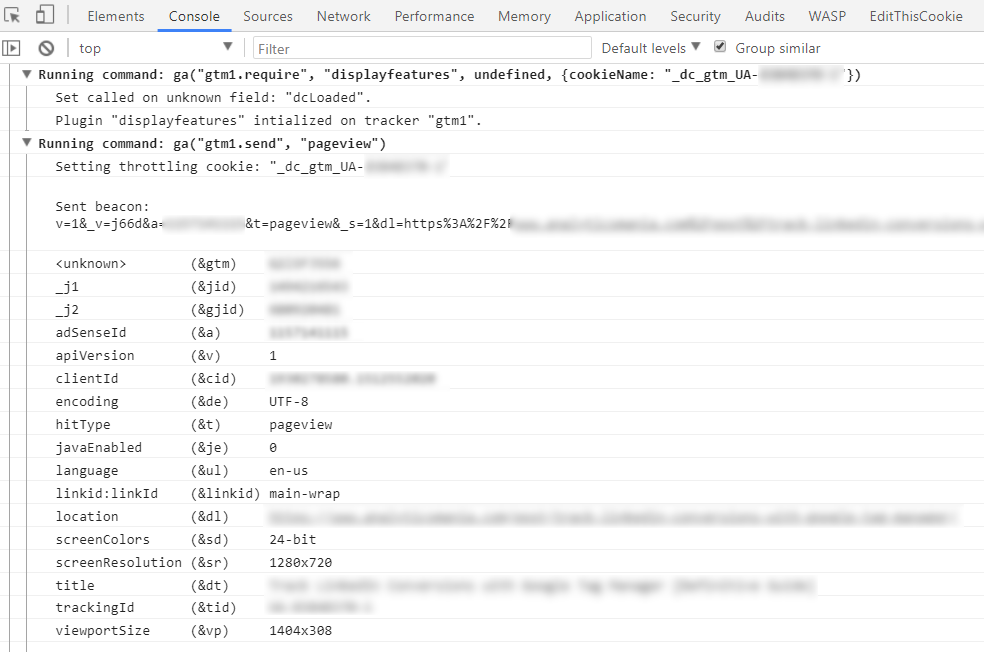
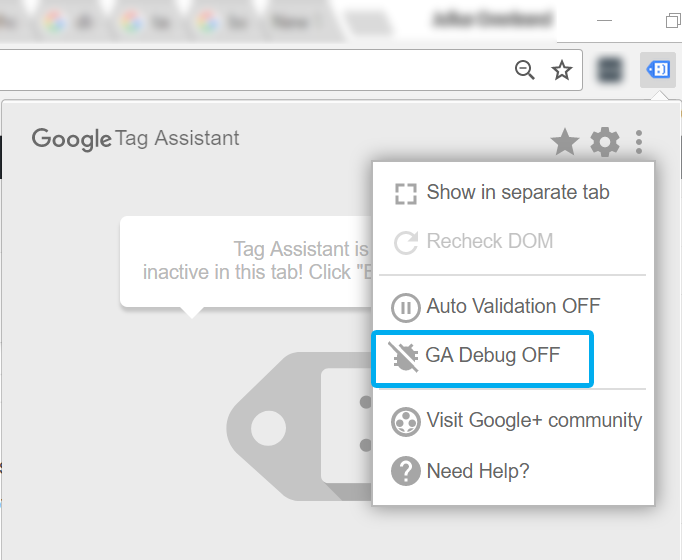
But did you know that Tag Assistant has the same built-in feature? While some of my readers will say Yes, of course!, I’m pretty sure the majority of you will be surprised. From my personal experience, I still see a lot of you using two separate plugins: Google Tag Assistant and GA Debugger.
All you have to do is just enable it manually here.
#7. Favorite domains
Up until this moment, you’ve learned that if you want to enable the Tag Assistant, you need to click the Enable button and then refresh the page.
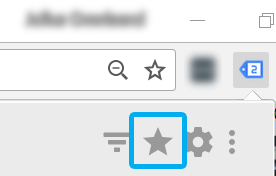
But if there are pages that you are constantly checking with the extension, you can save some time by adding that domain to the list of favorites. What a little nifty feature!
There are two ways you can do that:
- By clicking the Star icon in the plugin while being on the page you wish to add.
- By going to Google Tag Assistant’s settings and adding them one per line.

#8. Helps to troubleshoot Cross-domain Tracking Issues with ease
Session recordings reports (in particular, Google Analytics report) help you really easily identify reasons why your Cross-domain tracking implementation might not be working properly.
In the video below, a googler demonstrates how easy it is to debug the entire setup with the Tag Assistant. The good stuff starts at 5:03.
#9. List of all checks
If you’re interested in all possible checks that Tag Assistant does, you can find them here. Also, there’s an additional list right in the plugin. Go to Google Tag Assistant’s plugin settings, in the top right corner, click the button List Checks, and you’ll see a huge list of all possible checks that can be filtered. Also, each one of them contains a link to a relevant resource/reference.
#10. Other little handy features
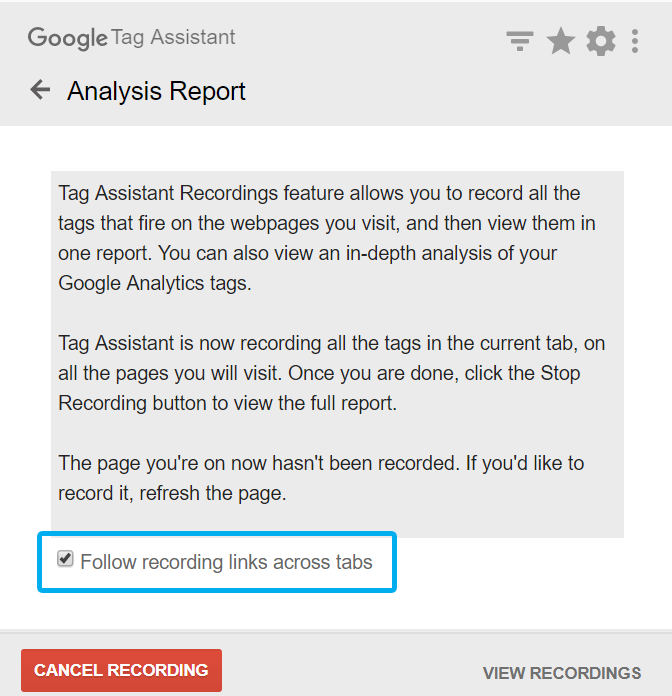
By default, when you enable Google Tag Assistant, you do it only on that particular browser tab. If you also wish to record the session while switching between multiple tabs (because some links might open a new tab), you can do that by clicking a checkbox right after pressing the Record button.
For your convenience, you can automatically open all recording sessions after they have been completed. In order to do that, go to extension’s settings and tick the checkbox Auto open recordings report when recording is stopped.

Google Tag Assistant is not perfect
Although this extension is definitely very useful to debug your Google Products installed on a page, the Tag Assistant is far from being perfect. For example, it might report false issues when it comes to debugging single-page applications. Here’s more information about that.
More Extensions for Google Tag Manager
Although Google Tag Assistant is the best-known, it’s not the only GTM extension for Chrome. I’ve prepared a couple of lists for extension maniacs, so feel free to check them out:
- 12 Top Google Tag Manager Extensions for Chrome
- 5 Less-known GTM and Google Analytics Extensions for Google Chrome
Google Tag Assistant Tutorial: Final words
In this Google Tag Assistant tutorial, I’ve explained how the extension works, what it does, and several neat tricks that can make your debugging faster and more efficient.
I don’t expect anyone reading this guide to look surprised because they have never heard of a Google Tag Assistant. Far from it! It’s a well-known extension, well promoted by the big G. However, I hope that you learned at least one or two new things today.
If this Google Tag Assistant tutorial wasn’t enough and you’re still hungry for some knowledge, head over to official Google’s Reference.
And as always, the comments section is at your service. Did I miss anything significant? Let me know.
Source: analyticsmania