When you implement Google Analytics 4, you are tracking your own interactions/events as well. That’s the default. That becomes even a larger problem when you’re working with a larger business (having more employees). Every visit/event made by an employee skews your data. Luckily, this can be fixed because you can exclude internal traffic in Google Analytics 4.
But there are several catches here. If you exclude yourself, you won’t be able to see your events in the DebugView (while testing with GTM). At least that’s what I noticed while debugging. This is inconvenient.
And if you have to exclude multiple people, relying on the IP address might not be the best option. In this blog post, I wanted to show you how to exclude internal traffic in Google Analytics 4 and also tackle the aforementioned two problems.
However, the IP-related option will also be described.
Table of contents
- The problem with the Internal Traffic Filter in GA4
- How Internal Traffic Filter works
- Method #1 – excluding internal traffic by IP address
- Method #2 – excluding internal traffic with the data layer
- Method #3 – excluding internal traffic based on a cookie
- Waiting for more powerful filters in Google Analytics 4
- Final words
Important: Some weird things. A delay?
While I writing this blog post, I did various experiments with filters in GA4 to understand how they work (because not every scenario is clearly explained in Google’s documentation).
The weird things started when sometimes, the same experiment (repeated several times) ended up with different results, thus trying to dig deeper was indeed very frustrating. Eventually, I came to the conclusion that there is some delay between editing/changing the filter and what you see in the DebugView.
For example, even 10 minutes after I deactivated the internal traffic filter, I still could not see my own events in the DebugView (until I changed my IP address).
So, this blog post is a result of various experiments and I hope I did that right. If you notice anything incorrect, please let me know.
There is always a chance that something was just not properly working in GA4 at that moment and maybe in the future (when you are reading this), this got resolved.
The problem with the Internal Traffic Filter in GA4
If you have ever tried to exclude internal traffic in Google Analytics 4, you have probably already found pages explaining how to use the Internal Traffic Filter. You can just go to your Admin > Data Streams > X Data Stream > Tagging Settings > Define Internal Traffic and then you enter your IP addresses.
Then you go to Admin > Data Settings > Data Filters > Internal Traffic and set it to Active.
Done, you have excluded your internal traffic based on IP addresses. But there’s one catch.
What if you want to exclude your internal traffic (including your own) but when you debug the GA/GTM setup, you’d still like to see yourself in the DebugView of GA4? With your current setup, that is not possible. You just won’t see yourself in the DebugView. At least, that’s what was happening to me.
One option here could be to create a separate GA4 property for testing and then (if you are in the preview mode) you could create a Lookup Table variable that picks the right property. If you’re in the Preview mode, then you send data to the testing property. If you’re not debugging, the data flows to the live property.
And there’s another option that I’m going to show you. It will involve a single (live) GA4 property. If you are not debugging, your data will be excluded. But if you are debugging (with GTM’s preview mode), then your data will be visible in the DebugView (but not standard reports). Thus, you are not going to litter your data collection.
How Internal Traffic Filter works
One last thing before we actually dive into the techniques/setup.
When you define your internal traffic (in the tagging settings of a Data Stream), Google Analytics 4 tracking code (activated on your site) starts adding an additional parameter tt=internal to every request. This parameter means “traffic type” a.k.a. traffic_type.
The default Internal Traffic Filter (that can be found in Admin > Data Settings > Data Filters) is preconfigured to exclude all the hits that contain the traffic_type=internal parameter (a.k.a. tt=internal). And it will do that once you set the filter to “Active”.
So, in this blog post, I’ll explain how to use that traffic_type=internal parameter and exclude internal traffic in GA4. But if someone is debugging with GTM’s preview and debug mode, then traffic_type’s value will be different and you would still see it in the DebugView.
Method #1 – excluding internal traffic by IP address
Let’s start with the classic. This might work if not many people are involved in running a business and you can easily exclude their hits by their IP addresses. This method does not work well if you have to enter a lot of different IP addresses or some IP addresses are not static (read: regularly changing).
Step #1. Define your internal IP addresses
In Google Analytics 4, go to Admin > Data Streams and select your website stream.
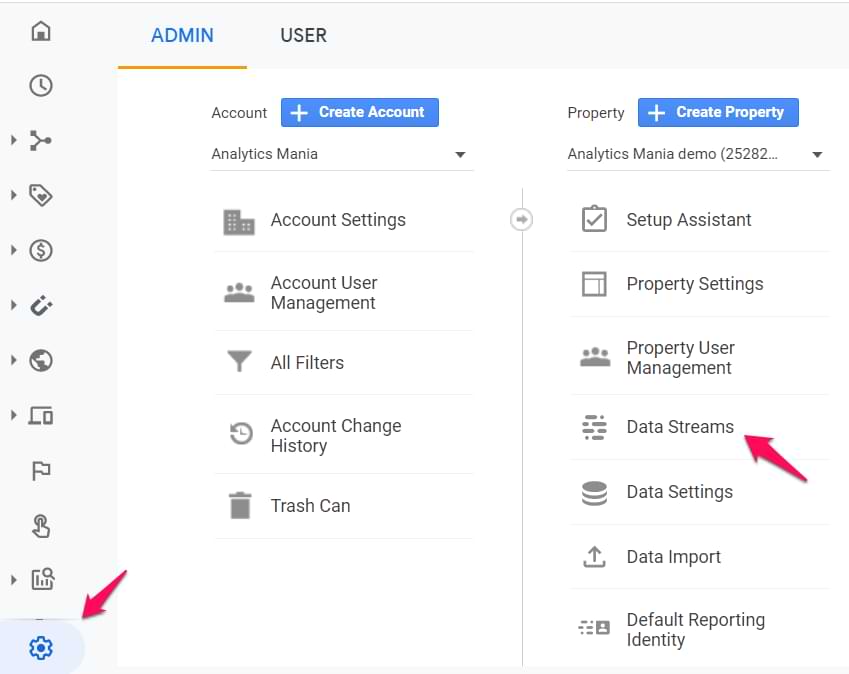
Then click Tagging Options:
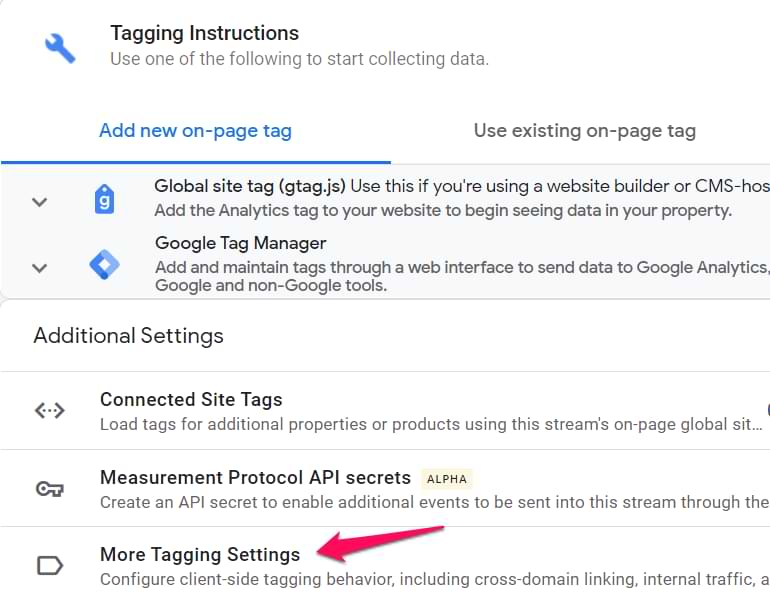
And select Define internal traffic. Here you can create new internal traffic rules. If you are working with multiple IPs, you can create separate rules for each IP. I really hope, that in the future, regular expressions will be supported here as well.
To make things simple, you can always enter “internal” in the traffic_type value field. Then it will be enough to just have one Internal Traffic filter in the Data Settings of your GA property.
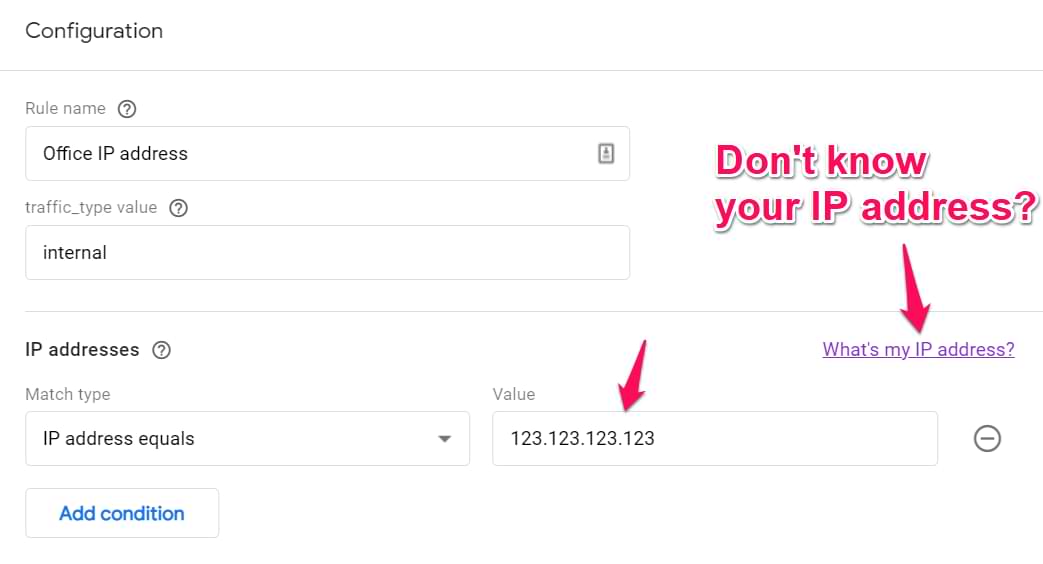
If you don’t know what is your IP address, click the link on the right side.
Step #2. Create a developer filter in GA4
You might be wondering what is the difference between a developer filter and an internal traffic filter in GA4. Both of them exclude data from the regular reports in GA4 (by checking different parameters).
The developer filter is checking the debug_mode or debug_event parameters while the internal traffic filter is looking for traffic_type.
But the key difference here is that you can see developer traffic in the DebugView of GA4 while the internal traffic is not displayed anywhere. And if your hits to GA contain both the debug_mode and traffic_type=internal, then the internal traffic parameter gets a higher priority and you won’t be able to see your hits in the DebugView.
So what can we do here? I’ll answer that in the next chapter. But first, let’s create a developer filter (because it’s is not ready by default). In GA4, go to Admin > Data Settings > Data Filters > Create Filter. Select Developer Traffic. Enter the following settings:

You can enter any name in the “Data Filter Name” field. Set this filter to Testing (for now). Save it.
Step #3. Create a lookup table in GTM to override the traffic_type parameter
This is where the magic will happen. If you remember, in one of the previous chapters, I mentioned that GA4 automatically adds a tt=internal (traffic_type) parameter to all hits if they are coming from one of your internal IP addresses.
What we are going to do is to create a Lookup table variable that manipulates the value of the parameter. If we have the GTM preview mode enabled, then we will change the tt’s value to developer (or anything else). But if the Debug Mode is disabled, then we will not do any modifications and let the GA4 handle this.
First, create an Undefined variable. In GTM, go to Variables > New > Undefined and save the variable (its name can be, well, Undefined).

Now, let’s go to Variables > Customize (in the Built-in variables section) and enable the Debug Mode variable.
Finally, let’s go to Variables > New > Lookup table and enter the following settings:
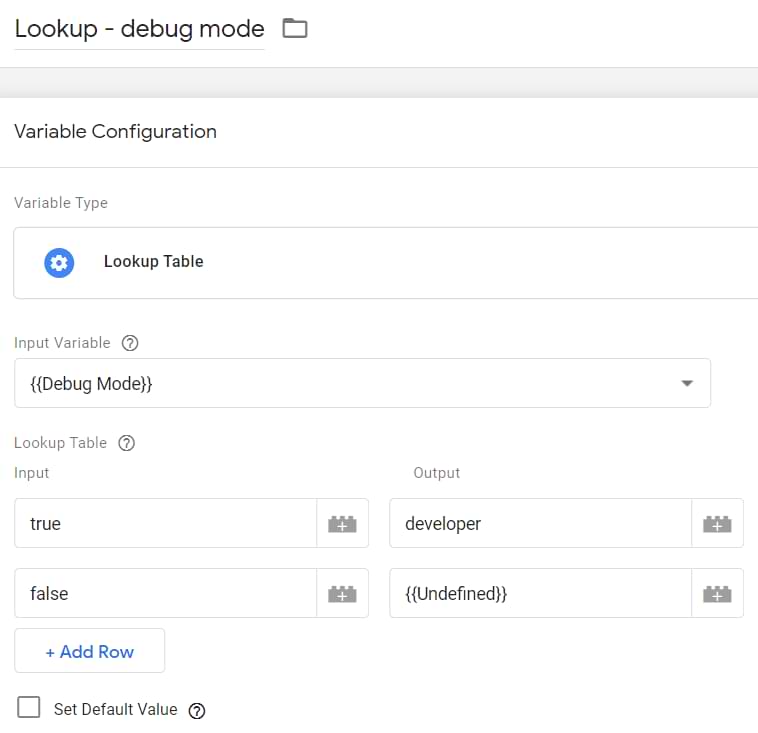
Here we are using the Debug Mode variable as an input. If the GTM preview mode is enabled, this variable will return true, therefore, the lookup table variable will return the word “developer”. If GTM Preview mode is not being used, the Debug Mode variable will return false, therefore, we will return undefined. That’s why we created the Undefined variable.
This is not the same as just entering “undefined” in the field. In JavaScript, “undefined” surrounded by quotation marks is a string (text). But undefined means no value. If you just enter the word undefined in the Lookup table, that is a string.
Save the variable.
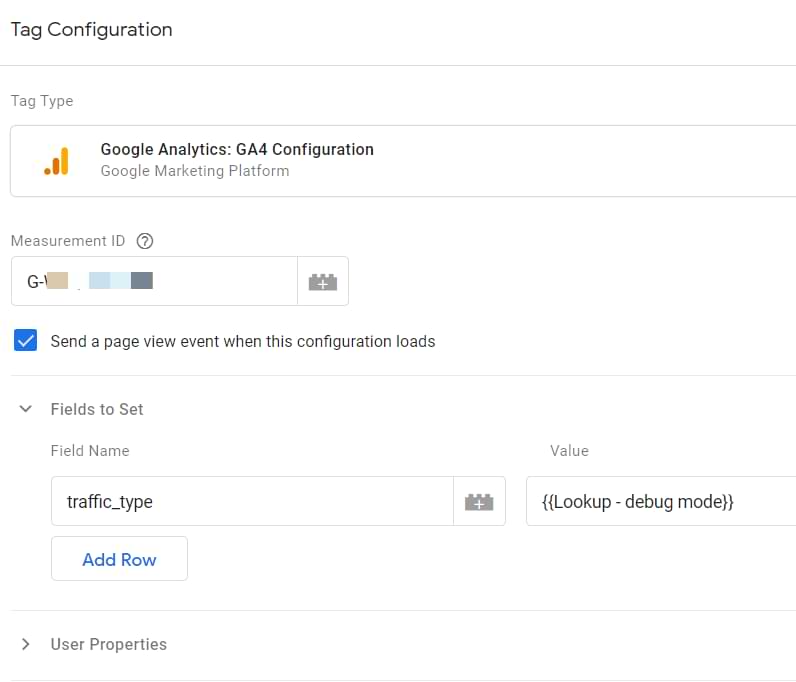
Finally, go to your Google Analytics 4 configuration tag and enter the following parameter: traffic_type. And its value should be the lookup table you’ve just created.

Step #4. Test the filters
Now, it’s time to test. Enable GTM’s preview mode. And go to your website (obviously, you should be browsing from the IP address that is configured in the Internal Traffic section of your Data Stream). Go to the DebugView of GA4.
First of all, you should still be seeing hits coming from your device. Click on any event in the event stream and check the parameter traffic_type. Its value should be developer.
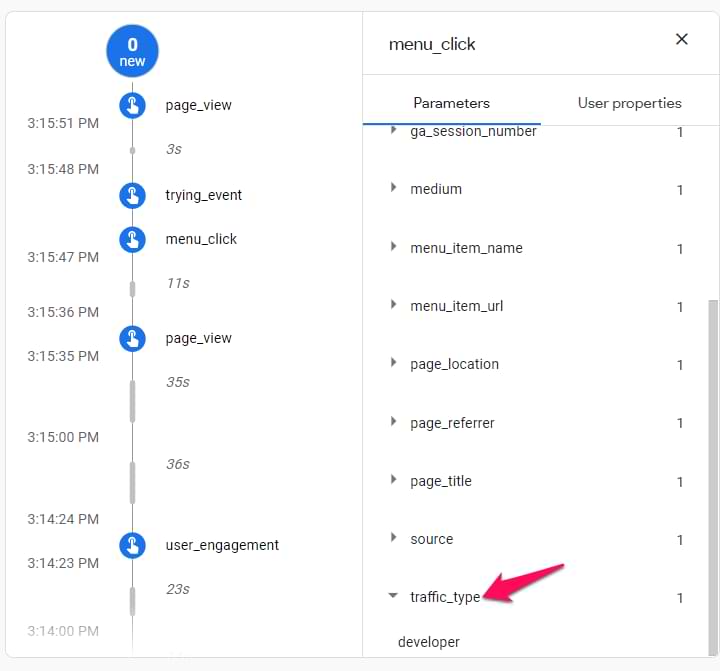
Also, in that very same event, you should see the Debug Mode parameter too.
Remember: both filters (developer and internal) are not active yet. They are in the testing mode, which means that the soon-to-be-excluded data is still visible in the regular GA reports. When filters are in the testing mode, an additional dimension is added to them called Test data filter name. You can use it as a secondary dimension (or in Analysis Hub) to check how much of the data would have been excluded if the filters were active. You can also more learn about the filters here.
Step #5. Activate both filters
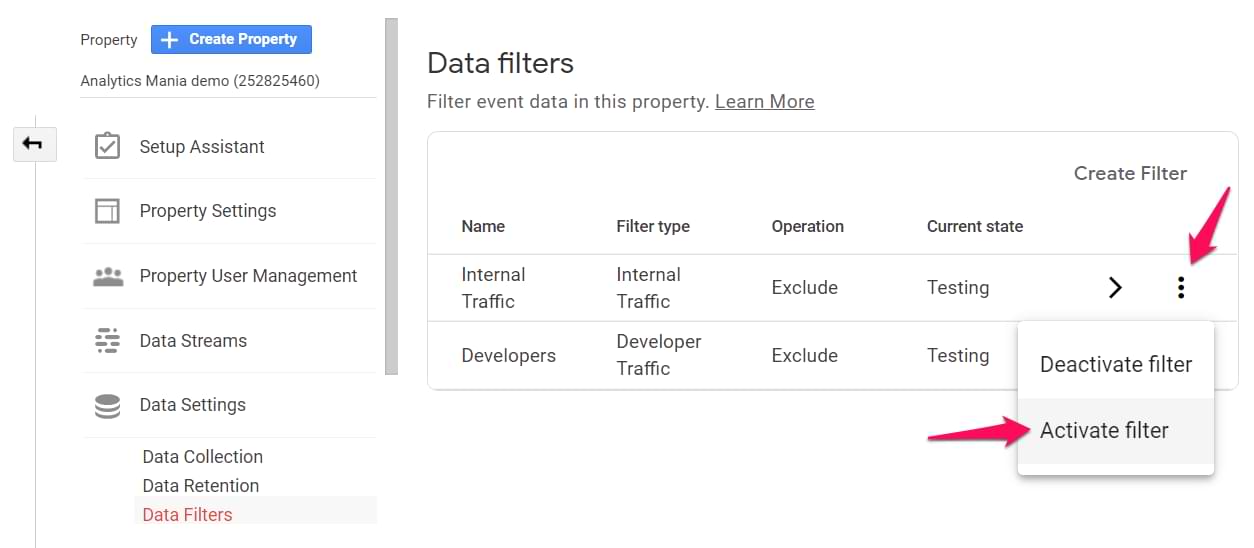
The last step is to activate both filters. Go to Admin (in GA) > Data Settings > Data Filters and set both triggers (Internal traffic and developer traffic) to active. You can do that by opening each filter, changing their Filter state, and then saving the changes. Or you can just activate them from the list:

Now do the test once again.
- Browse from the IP address that is defined as Internal
- Have the GTM preview mode disabled. Browse your website (to send some events to GA4)
- Check the DebugView. You should not be able to find your device and see new events coming from it.
- Now enable GTM’s preview mode. Browse the website once again.
- Check the DebugView. You should now be able to find your device and start seeing some data.
Method #2 – excluding internal traffic with the data layer
Another method does not involve IP addresses. Maybe it is possible for your developers to somehow identify that the visitor/user who’s now browsing your website/web application is an internal user? Maybe they can identify that by a user id, or maybe they can think of something else? Talk to them.
Step #1. Getting the internal data parameter into the Data Layer
If that is possible, you should ask them to push the user_type (or traffic_type, or whatever) parameter to the data layer that could help you identify that the visitor/user belongs to your own company. If a visitor belongs to your company, then the parameter’s value should be internal. If a user/visitor does not belong to your company, no dataLayer.push should happen.
Here’s a sample dataLayer.push code that your developer could activate if the user/visitor belongs to your company:
<script>
  window.dataLayer = window.dataLayer || [];
  window.dataLayer.push({
    'event': 'traffic_type',
    'traffic_type': 'internal'
  });
</script>
Event key is not required (but recommended). It’s important that this code is activated before the GTM Container snippet is loaded.
Then create a Data Layer Variable with the following settings:
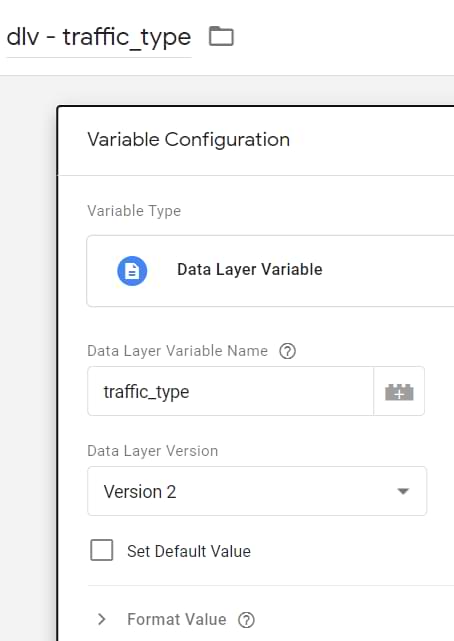
Step #2. Create a developer filter in GA4
In GA4, go to Admin > Data Settings > Data Filters > Create Filter. Select Developer Traffic. Enter the following settings:
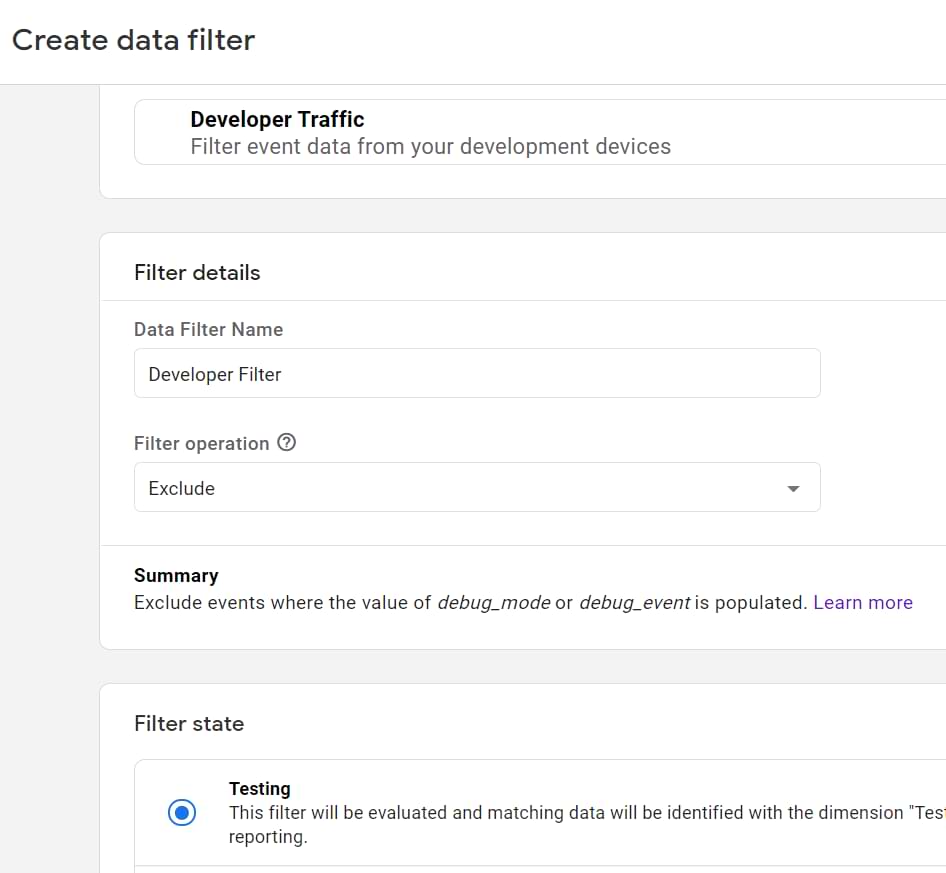
Set this filter to Testing (for now). Save it.
Step #3. Create a lookup table in GTM to override the traffic_type parameter
Go to Variables > New > Lookup table and enter the following settings:
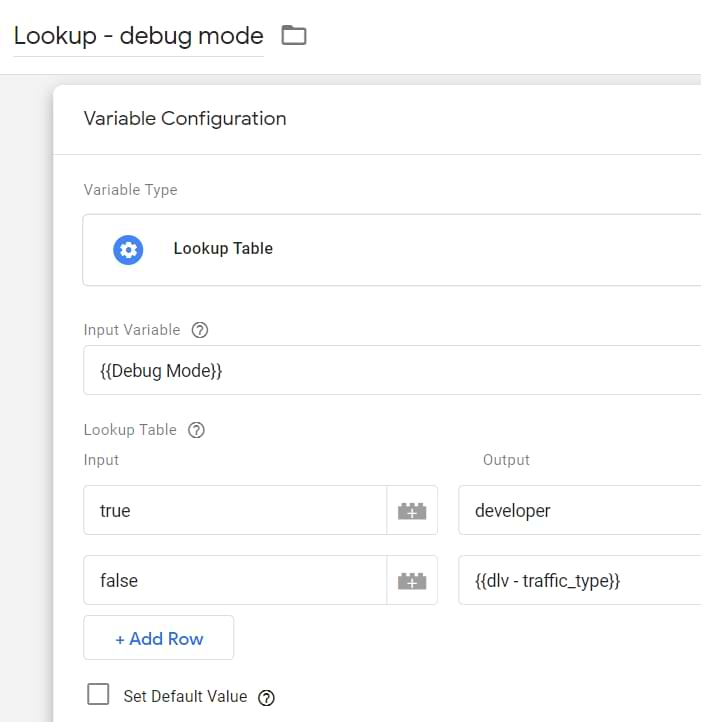
Here we are using the Debug Mode variable as an input. If the GTM preview mode is enabled, this variable will return true, therefore, the lookup table variable will return the word “developer”. If GTM Preview mode is not being used, the Debug Mode variable will return false, therefore, we will return the value of the Data Layer Variable that you created in the first step.
If the data layer contains the traffic_type key, then its value will be sent to GA. If the key does not exist, then it will set to undefined (meaning that GA4 will not send the traffic_type key at all).
Save the variable.
Finally, go to your Google Analytics 4 configuration tag and enter the following parameter: traffic_type. And its value should be the lookup table you’ve just created.
Step #4. Test the filters
Follow the same process as I have described here.
Step #5. Activate both filters
The last step is to activate both filters. Go to Admin (in GA) > Data Settings > Data Filters and set both triggers (Internal traffic and developer traffic) to active. You can do that by opening each filter, changing their Filter state, and then saving the changes.
Or you can just activate them from the list:
Then test everything once again (as I have described here).
Method #3 – excluding internal traffic based on a cookie
Another possible way to exclude internal traffic in Google Analytics 4 could be by using a cookie. You tell your employees to visit a certain unique URL, then you set a cookie with GTM and use its value in the lookup table variable.
Step #1. Set a cookie for internal users
However, keep in mind that just like any other method mentioned in this article, this one has its flaws. If most of your employees are using Safari (or browse with iOS), the Intelligent Tracking Prevention will limit the lifetime of a cookie and your employees will have to often revisit that unique link.
Let’s say, that your website’s URL is www.mybusiness.com. Then you can tell your employees to visit the following URL: www.mybusiness.com?internal_user=true
Then go to Google Tag Manager and create a Custom HTML tag, paste the following code inside of it:
<script>

 var cookieName = "gtm_internal_user"; // Name of your cookie
 var cookieValue = "true"; // Value of your cookie
 var expirationTime = 31104000; // One year in seconds
 expirationTime = expirationTime * 1000; // Converts expirationtime to milliseconds
 var date = new Date();
 var dateTimeNow = date.getTime();

 date.setTime(dateTimeNow + expirationTime); // Sets expiration time (Time now + one month)
 var date = date.toUTCString(); // Converts milliseconds to UTC time string
 document.cookie = cookieName+"="+cookieValue+"; SameSite=None; Secure; expires="+date+"; path=/; domain=." + location.hostname.replace(/^www./i, ""); // Sets cookie for all subdomains

</script>
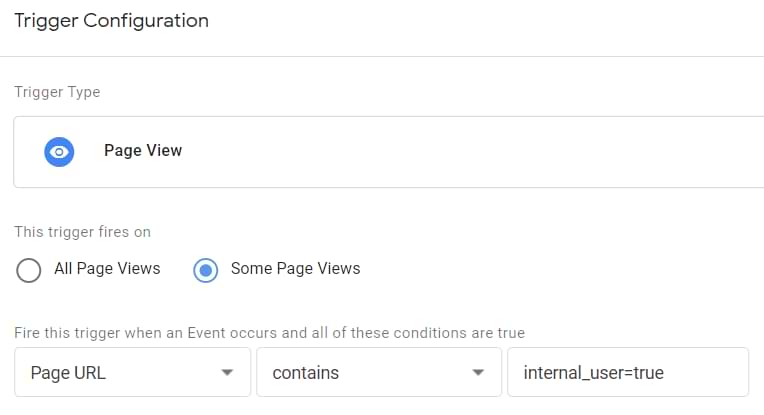
Set this tag to fire on a Pageview trigger when Page URL contains internal_user=true.
Step #2. Cookie variable
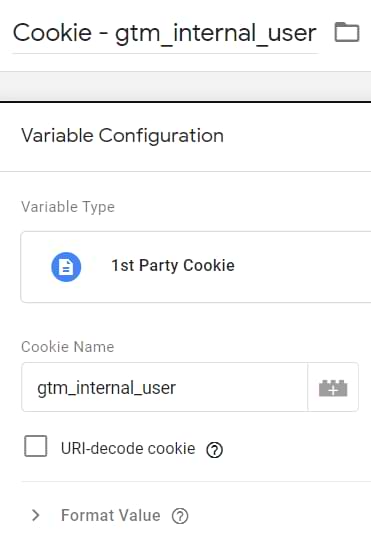
Go to GTM > Variables > 1st Party Cookie and enter the following settings:
Save the variable
Step #3. Create a developer filter in GA4
Create a developer filter in GA4 just as I have explained it here.
Step #3. Create a lookup table in GTM to override the traffic_type parameter
Go to Variables > New > Lookup table and enter the following settings:
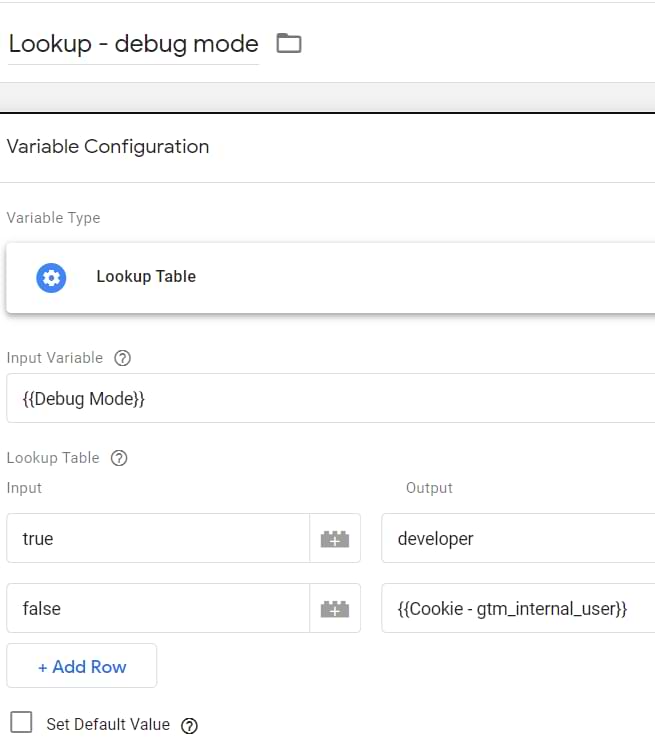
Here we are using the Debug Mode variable as an input. If the GTM preview mode is enabled, this variable will return true, therefore, the lookup table variable will return the word “developer”.
If GTM Preview mode is not being used, the Debug Mode variable will return false, therefore, we will return the value of the 1st Party Cookie Variable that you created in the first step. If the cookie exists, then its value will be sent to GA. If the cookie does not exist, then it will set to undefined (meaning that GA4 will not send the traffic_type key at all).
Save the variable.
Finally, go to your Google Analytics 4 configuration tag and enter the following parameter: traffic_type. And its value should be the lookup table you’ve just created.

Step #4. Test the filters
Follow the same process as I have described here.
Step #5. Activate both filters
The last step is to activate both filters. Go to Admin (in GA) > Data Settings > Data Filters and set both triggers (Internal traffic and developer traffic) to active. You can do that by opening each filter, changing their Filter state, and then saving the changes.
Then test everything once again (as I have described here).
Waiting for more powerful filters in Google Analytics 4
As of the moment of writing this blog post, GA4 filters are still way behind Universal Analytics. Hopefully, we will have more powerful options in the future to exclude the internal traffic (e.g. based on a custom dimension).
Exclude Internal Traffic in Google Analytics 4: Final words
The main benefit of how I exclude internal traffic is that it is still visible in the DebugView as long as you have the GTM Preview mode enabled. That way, you can debug your incoming hits without the need of doing some manual hacks to overcome the traffic_type=internal.
Keep in mind that none of the aforementioned solutions are perfect:
- IP-based filters won’t work if your employees have dynamic IP addresses
- dataLayer.push-based filtering requires developer’s input + still can miss some employees who browse anonymously-ish and haven’t logged in anywhere so that your developer could identify them
- The cookie-based solution is, well, based on cookies. Cookies cannot be shared across multiple devices of the same visitor. Cookies can be cleared. Cookies expire sooner because of ITP on iOS or Safari. Thus your employees might need to regularly revisit that unique URL (that sets the cookie).
I really hope that my experiments with filters were correct and that if you indeed exclude your internal traffic, it is not displayed in the debug view (until you do the modifications with the lookup table). If on the other hand, I’m wrong, please let me know and I’ll update the guide accordingly.
Source: analyticsmania