With React, building high performance web applications became very easy because of the framework’s re-rendering on the JavaScript virtual DOM, which helps it to quickly determine the changes needed when a user event is occurring. When writing complex application with React you will run into some performance issues, either because the application re-renders when it really doesn’t need to or because the states aren’t being handled properly, amongst other reasons.
What exactly is regarded a high performance application?
Performance is really important when dealing with a complex application or any application. In fact if your application doesn’t cover 60 frames per second (fps) which would give it like 16.7ms per frame, it is more than likely underperforming with regards to the standards. When your app is slow, it obviously takes more time to carry out instructions in good time, leading to a poor user experience.
Note: Optimizations are possible without React, true! However, as you develop more complicated views, maintaining and comparing virtual DOMs can become confusing and cause underperformance. Fortunately, React provides some tools to detect where performance issues exist and a means for avoiding them.
React Profiler
The concept of the react profiler is to collect timing information about components, the time rendered and committed in order to identify when each component actually rendered and at what speed. Basically to explain to you how fast or how slow your application is.
Profiling a React Application
To explain this process, I will be using a simple question and answer application, rendering on Mozilla Quantum browser, with the React Performance Devtool.
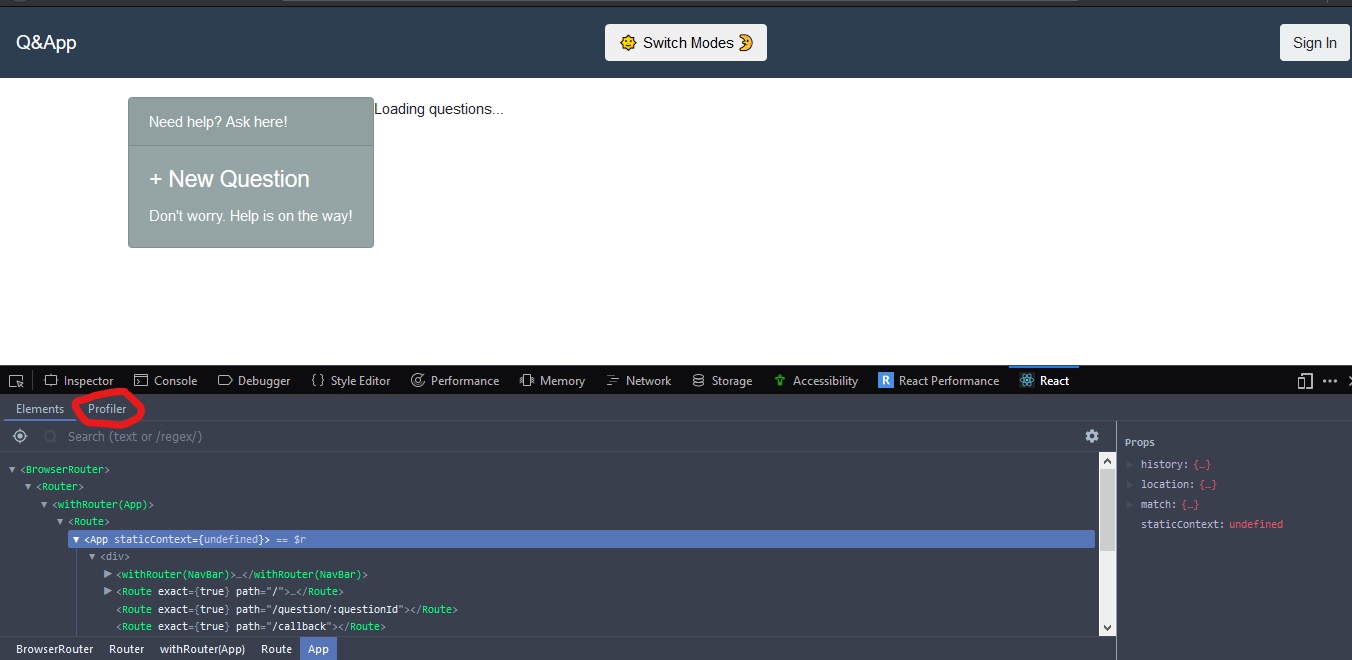
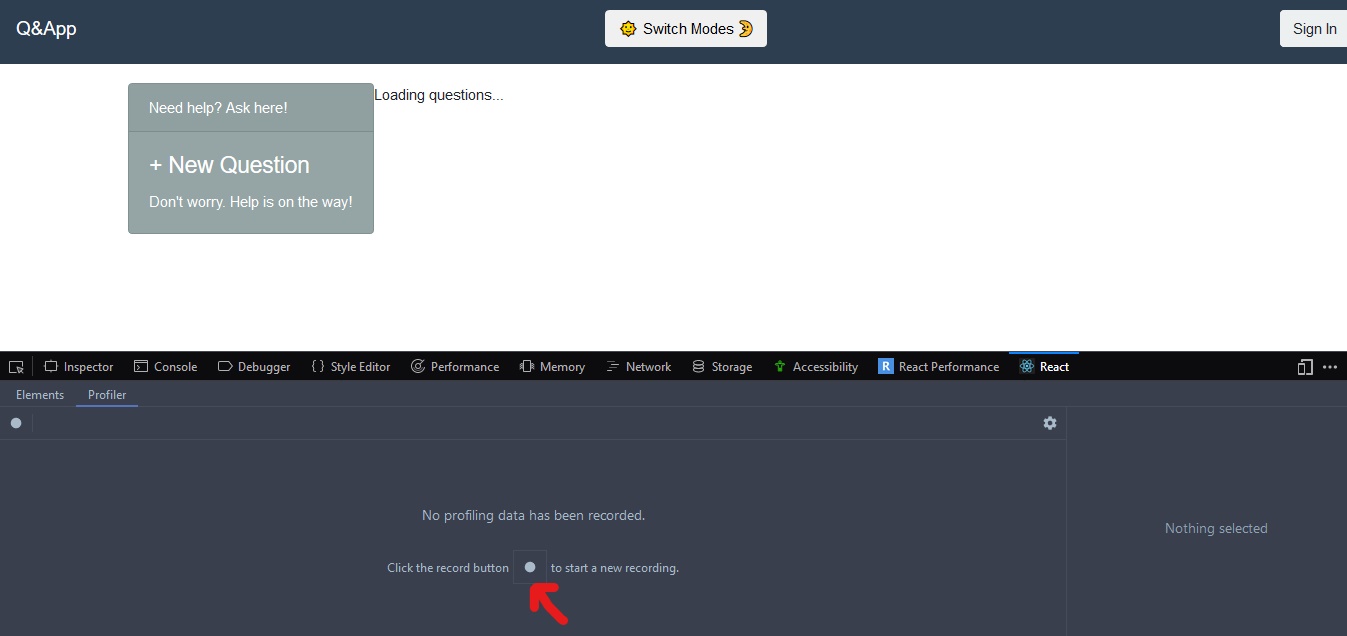
The React Profiler environment is empty at first, you’d also notice a record button. click on it to start profiling.
Once you click on the record button, the profiler automatically collects performance information each time your application renders. To end this, click on the stop button
The dev tool provides a way for you to monitor the performance data .
Forms of Performance Data
React has two phases where it does work for our application:
- Render: React determines what DOM changes need to be made by comparing render results with a previous render
- Commit: React applies any changes that need to happen. Add/remove from the DOM and call lifecycle hooks like
componentDidMountandcomponentDidUpdate
When profiling, we’ll be looking closely at the commit phase to see where performance dips are.
Filtering commits
The profiler runs for as long as you application renders, until you hit the stop button, you might have up to 30 commits depending on how many times your application renders. Say you want to know the commits that were faster than 500 milliseconds. The profiler offers a filtering option that can help you achieve this in these simple steps.
Step 1: Opening Settings
Click on the settings icon.
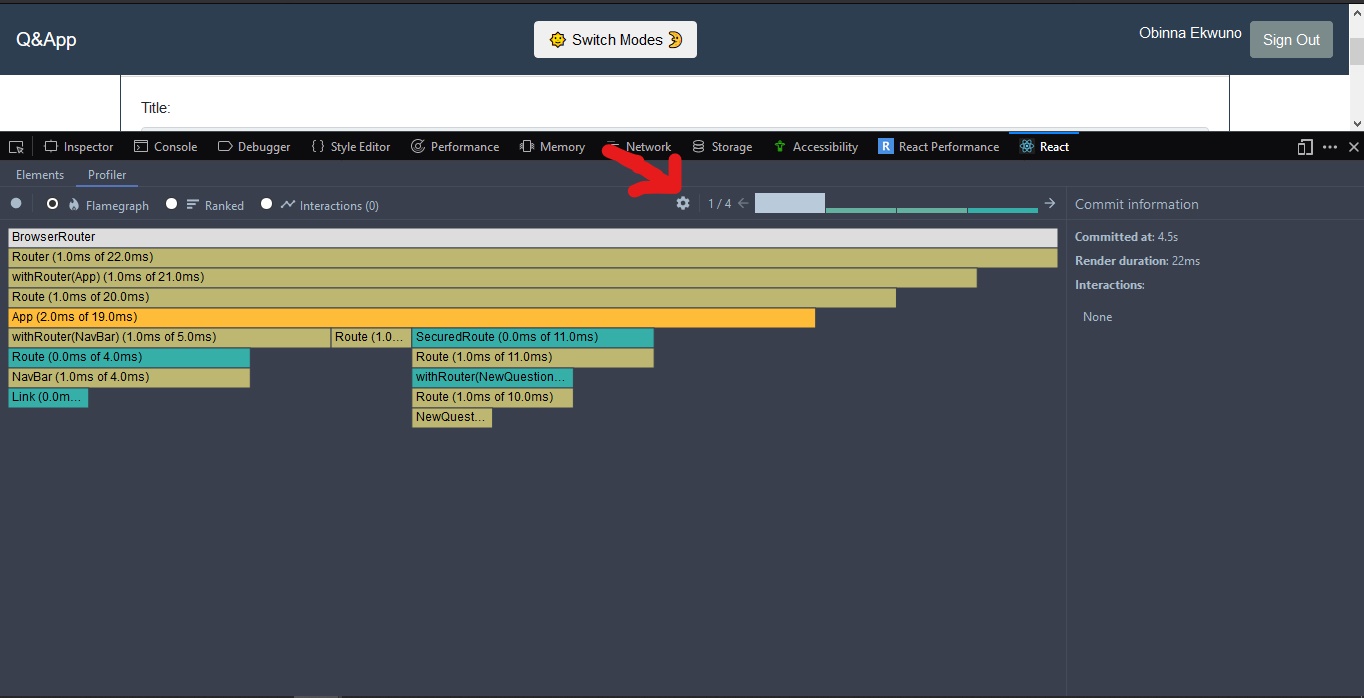
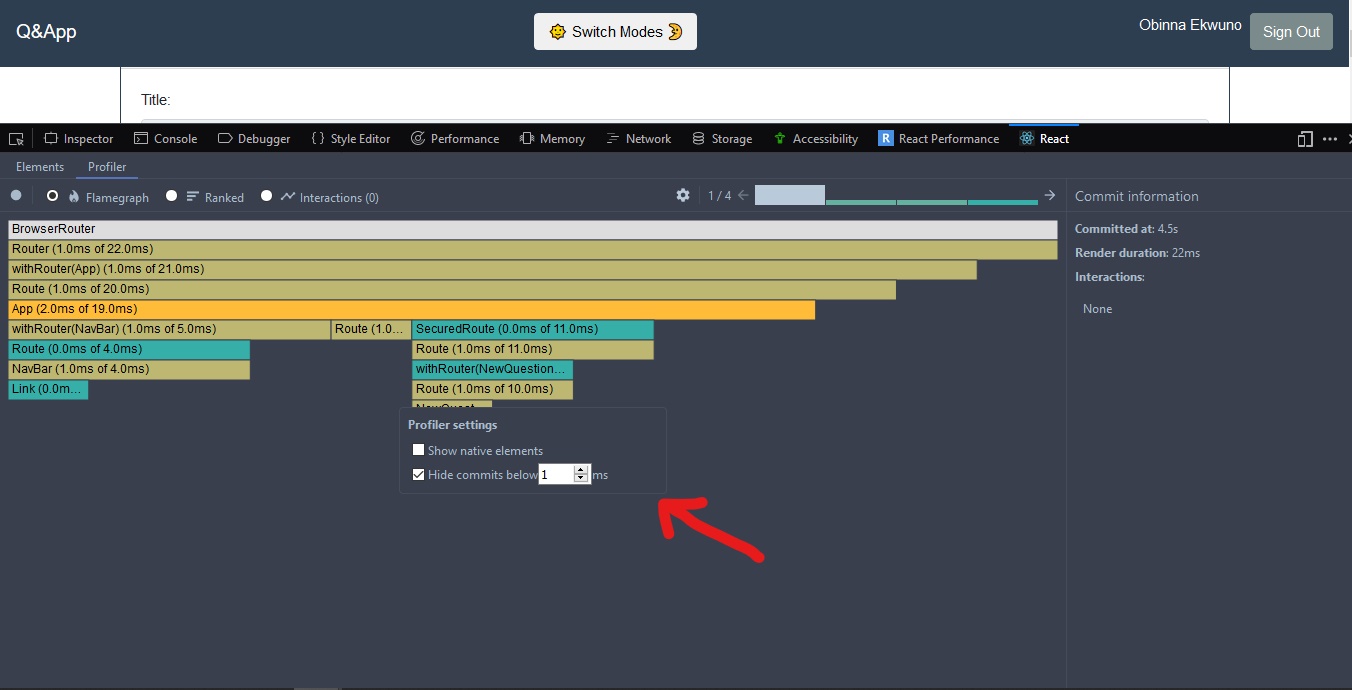
Step 2: Configure the Profiler
A drop down profiler setting shows, from where you can then ‘Hide commits below” a specific value, then veiw the changes on the upper right.
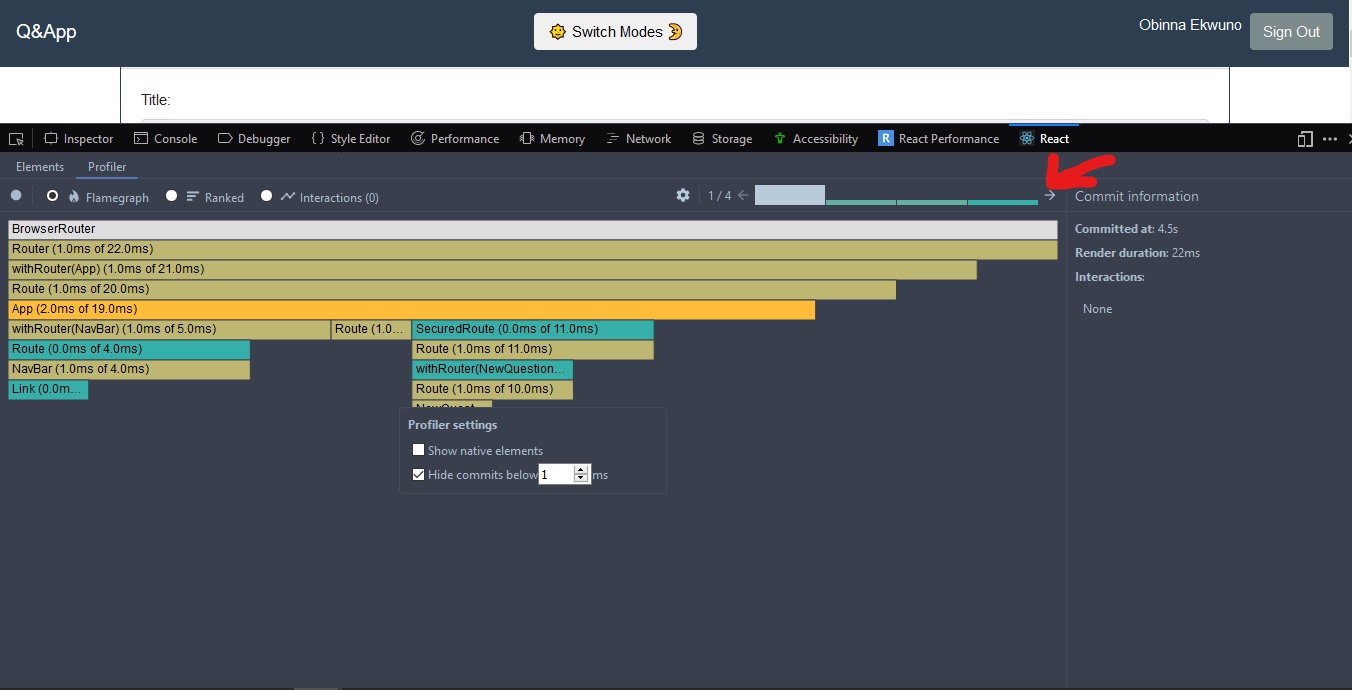
Browsing commits
Before we go further, have you ever wondered how react renders content? Basically it is made up of two phases, the render phase and the commit phase, the summary of how react renders is that it determines what changes need to be made by comparing the results from the user event and applies the changes in the commit phase.
The commit bar chart can be found in the far right, the currently selected commit is colored black, the color and height of each bar corresponds to how long that commit took to render.

Note: When the commits are gray it means they weren’t rendered, this could be as a result of setState never being called in the component.
Ranked Chart
The ranked chart view of representing performance shows a React component in bar format. It is arranged in descending order, with the components that took the longest to render at the top. A component’s rendering time also includes the time it took to render the children components.
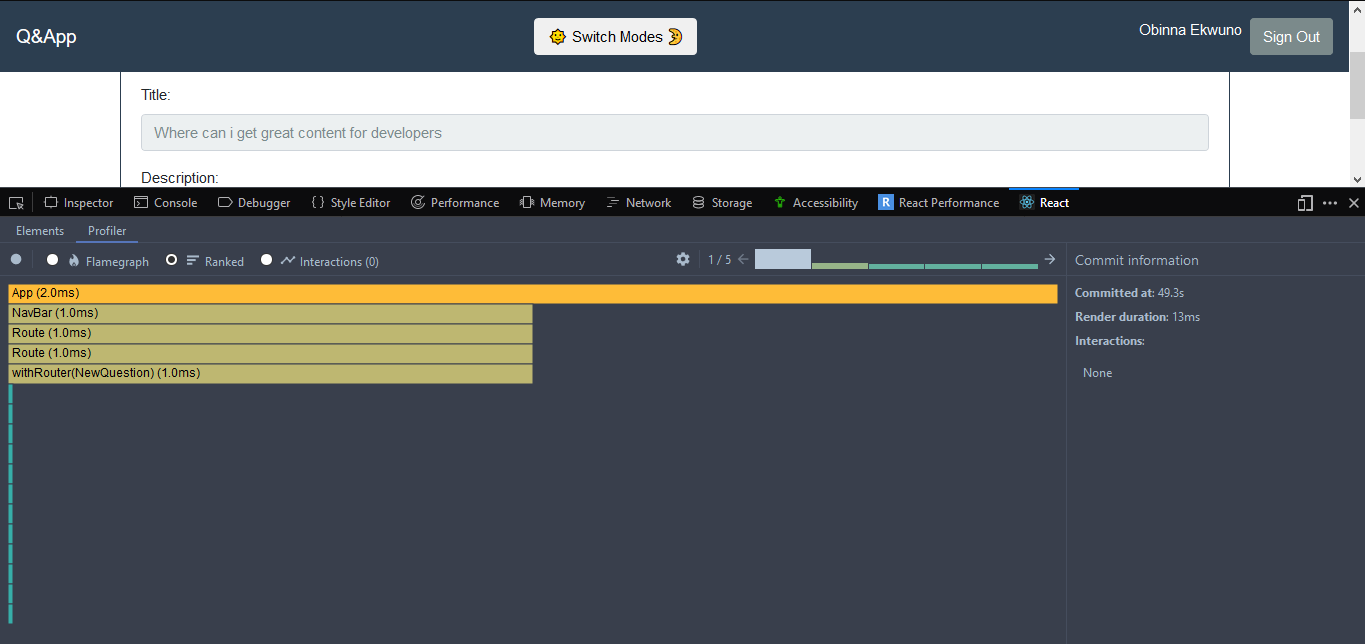
Component Chart
When we want information on how many times a particular component rendered, we can use the React profiler’s component chart feature which has bars that represent the time when the component rendered. The color and height of each bar shows how long the component took to render relative to other components in a particular commit. You can get here by simply double tapping the rank bars.
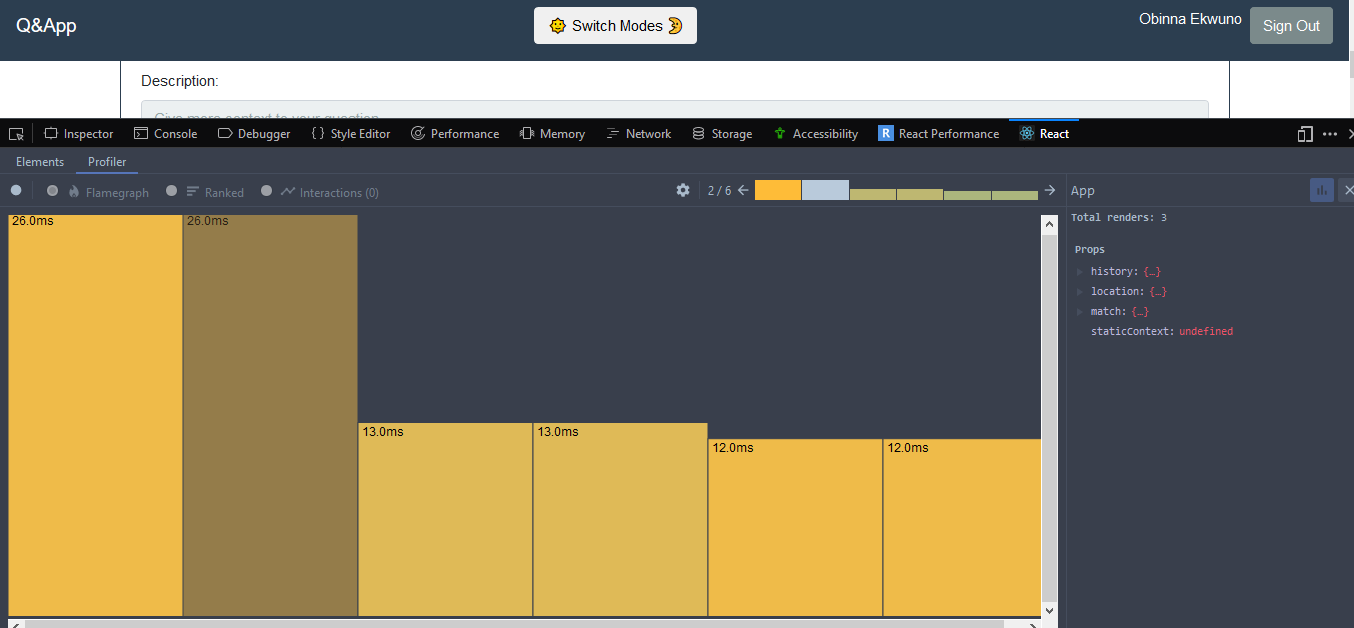
Interactions
React recently added another experimental API for tracing the cause of an update. “Interactions” traced with this API will also be shown in the profiler. You can also see which interactions were traced for a particular commit from the flame chart and ranked chart views.
Flame Chart
The flame chart view represents the state of your application for a particular commit. Each bar in the chart represents a React component. The size and color of the bar represents how long it took to render the component and its children.
- width of a bar represents how much time was spent when the component last rendered
- color represents how much time was spent as part of the current commit
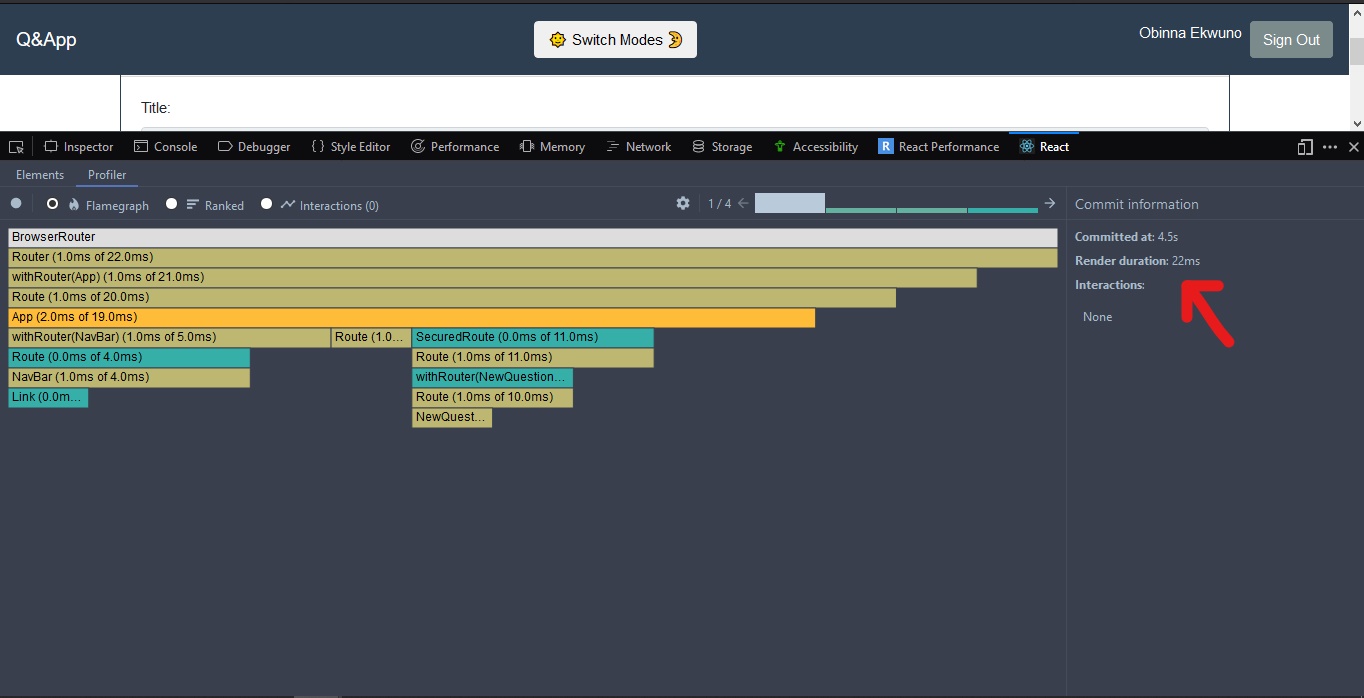
Common Problems
When the following happens, don’t panic. Sometimes your app may have more than one root element, then you may see this error message
- No profiling data has been recorded for the selected root
What this simply means is that no performance data was recorded for the root you are currently on. In this case, try selecting a different root in that panel to view profiling information for that root
- No timing data to display for the selected commit
Sometimes a commit may be so fast that performance.now() doesn’t give DevTools any meaningful timing information.
The future of React Profiling
It will be fully compatible with the upcoming time slicing and suspense features. Which are features still being worked on by the good people at React .
External profiler
We can also run the react profiler in the application by using the following:
import React, { Component, unstable_profiler as Profiler } from 'react';

const logProfiler = ({
  ProfilerId,
  Phase,
  ActualTime,
  StartTime,
  CommitTime,
  Interactions,
}) => {
  console.log({
    ProfilerId,
    Phase,
    ActualTime,
    Basetime, //time taken by react
    StartTime, //time at which render starts
    CommitTime,
    Interactions, // this is gotten from the rapping API
  });
}
If you want to wrap profiler external in your code you also have to indicate the root you want to profile as thus
<Profiler id="image-grid" onRender={this.logProfiler} />The onRender prop is calling the profiler option and logging out all the information on the log
Source: Scotch.io