If you have tried to configure Google Analytics 4, you should already be familiar with custom dimensions. Basically, any custom text parameter that you send to GA4 (and that you want to use in the reports), should be registered as a custom dimension.
But you can also customize your setup by sending custom metrics. What are they and how can you configure them?
In this blog post, I’ll share the steps on how to configure custom metrics in Google Analytics 4.
First, let’s start with some theory, and then we’ll dive into the practical stuff.
Table of contents
- What are dimensions in Google Analytics?
- What are metrics in Google Analytics?
- A number can also be a dimension
- Examples of Custom Metrics
- How to configure custom metrics in GA4?
- Using Custom Metrics in GA4
- Final words
What are dimensions in Google Analytics?
To quickly understand the concept of metrics, first, let’s take a quick look at dimensions.
Dimensions are attributes. They describe something, e.g. a user, page, purchase, some other events, etc. To give you a clearer picture, here are some examples:
- Page URL: https://www.example.com
- Traffic source: google.com, analyticsmania.com
- Coupon code: SUMMER20, BFCM21
- Item category: apparel, shoes
- User country: United Stated, Lithuania
But what if you want to count something? E.g. how many pageviews did we get last month? How much money did we earn last week? That’s where the metrics come in.
What are metrics in Google Analytics?
Metrics are quantitative measures, They allow you to count, measure things (this sounds so vague but please, bear with me). With metrics, you can know how many times did the X happen, or how much did you get of Y, etc.
Here are some of the examples:
- Order total: 99.99
- Event count: 247
- Number of logins: 32
- Number of purchases: 4
- Product price: 19.99
Dimension lets you know WHAT kind of product was purchased but thanks to metrics, you can know HOW MANY times was the product purchased, what is the revenue of the product, etc.
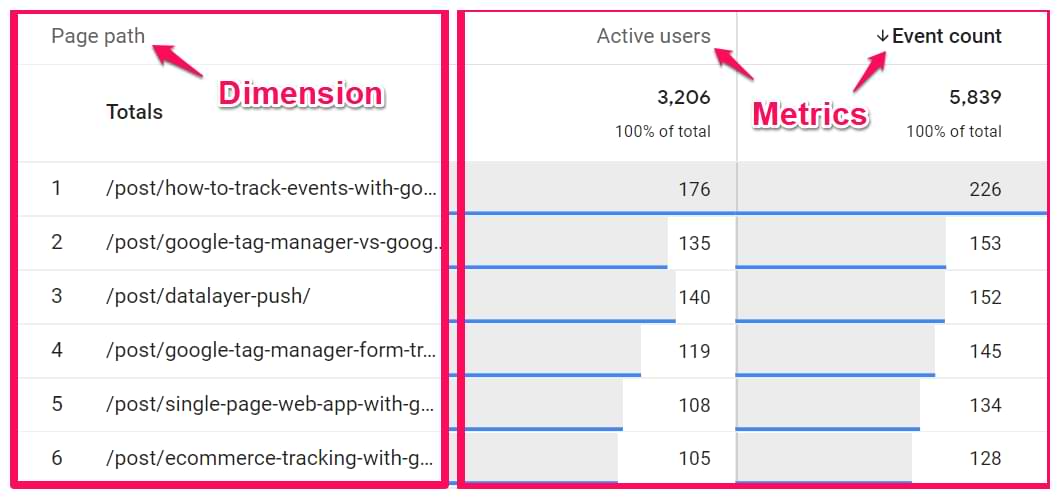
If we take a look at the report in Google Analytics, here’s the relationship between metrics and dimensions.
A number can also be a dimension
If you think that a number is always a metrics, that isn’t always true. Sometimes, a number can be a dimension too. Here’s an example. You have implemented scroll tracking that measures how many times do your visitors scroll past certain page height thresholds.
Those thresholds are 25%, 50%, 75%, and 90%. Let’s take a look at the report done with the Exploration report.
On the left side, we have a dimension called Percent Scrolled. On the right, we have the Event Count metric.
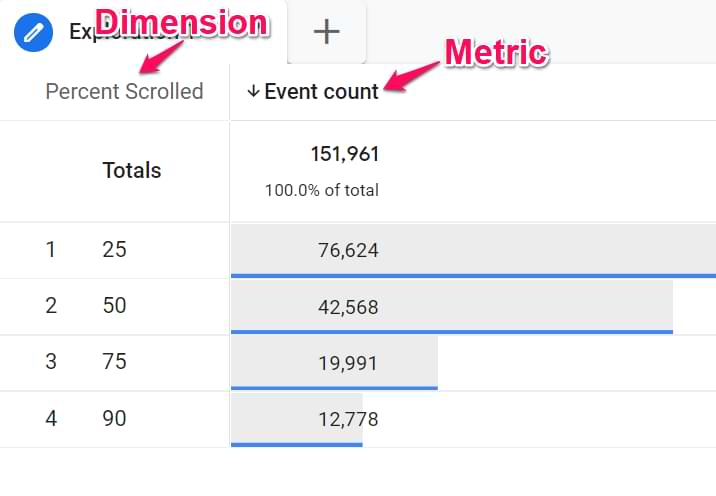
Even though the values on the left look like numbers, they are actually dimensions. They describe scroll thresholds that we track. There are 4 possible values in total.
And on the right side, we see how many times was each threshold reached.
Examples of Custom Metrics
Even though Google Analytics 4 has a bunch of built-in metrics, they do not cover all possible scenarios. Analytics tools are built to cover many general use cases but they will never adapt to your business’s uniqueness out of the box.
You have to customize.
You can send custom dimensions and you can also implement custom metrics. Here are some of the examples of custom metrics in Google Analytics 4 that you can implement:
- Number of videos views
- Number of form submissions
- Total discounted amount of purchases
Sure, you could know the number of video views by counting how many times did the video_start event occurred and have a report like this:
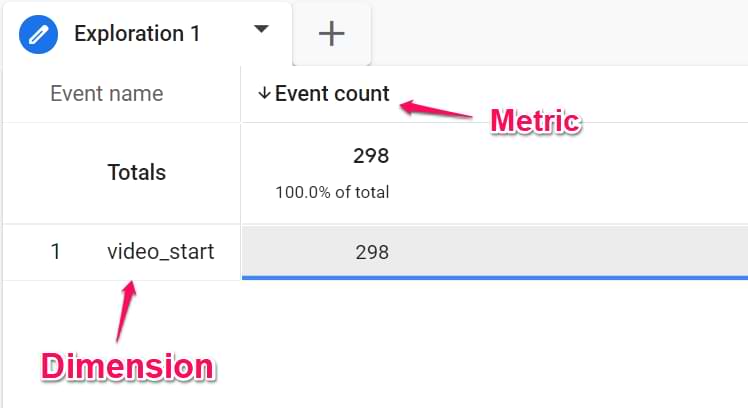
In the screenshot above, the dimension is Event Name and the metric is Event count.
But what if you wanted to see a report where you can have the number of form submissions and video views per page? Like this:
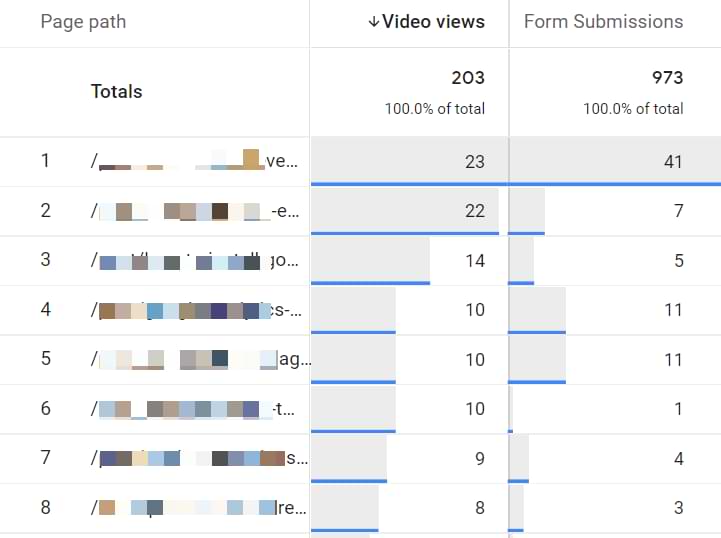
It would be much easier to create this report with custom metrics Video Views and Form Submissions. But Google Analytics 4 does not offer these metrics by default!
That’s where we could utilize custom metrics.
How to configure custom metrics in Google Analytics 4?
In this example, I will show how to get the Video Views metric in Google Analytics 4. First of all, answer this: what is a Video View?
Some might say that it is the number of times when visitors started to watch a video. Others might be more selective and say that we should track a video view only if a visitor watches at least 10 seconds of the video.
There is no correct answer here. It depends on the business goals and who collects/analyzes this data.
For sake of simplicity, let’s say that every time a “video_start” event is sent to GA4, we want to count this as a Video View and increment that metric by 1.
And that’s exactly what we should do. We should create a GA4 event tag that sends the video_start event together with a Video View metric (of which value is 1). Then GA4 will take that “1” and use it in the reports.
#1. Update the GA4 event tag
Let’s say that I already have created a Youtube trigger with the following conditions (this is just for the Start event):
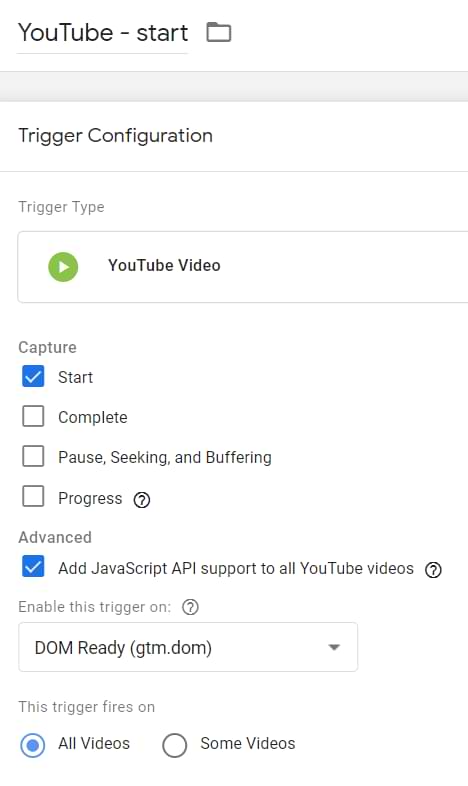
Then I will use that trigger to fire a tag with the following settings (note: all those GTM variables are built-in so make that you enable them in Variables > Configure):

This tag fires on the aforementioned Youtube video trigger.
It’s very important: this tag fires ONLY when the video_start event is sent. If you also want to track other interactions (like video_progress or video_complete), use a separate tag + trigger (but without the metric).
To include the custom metric in the tag, we have to add one more parameter to the tag. You can name it whatever you want, I’ll call it video_view and set its value to 1. This means that every time we fire this tag, that metric in GA4 will be increased by 1.
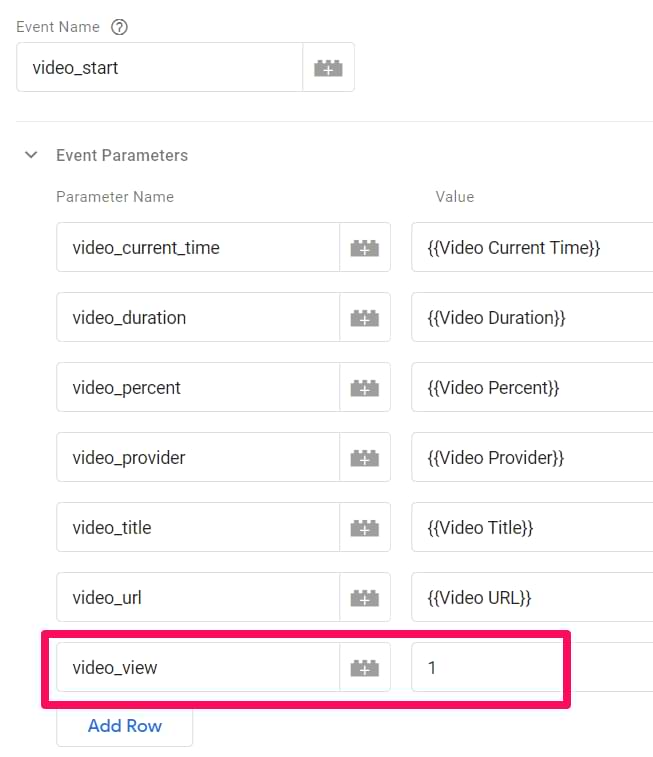
Save the tag.
#2. Test the tag
Enable/refresh the GTM Preview mode and go to your website where the embedded Youtube video player is located. Start playing the video.
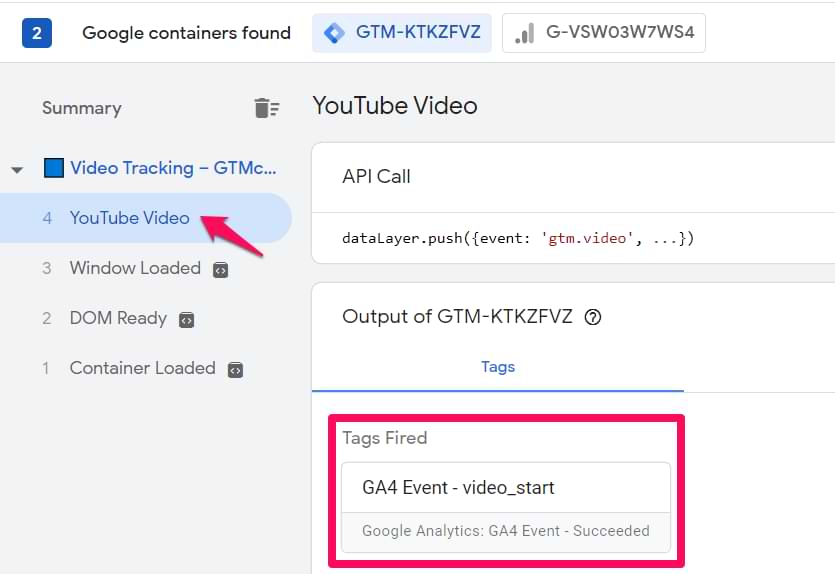
In the Preview mode, an event called Youtube video should appear. Click it and you should see the GA4 event tag fired.
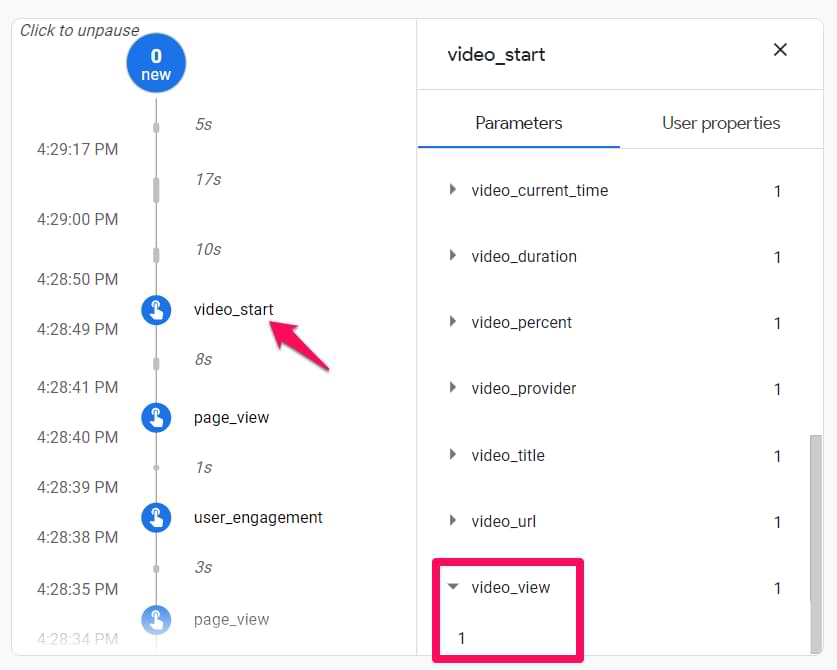
Now, go to Google Analytics 4 Debug View. You will find it at the bottom left corner of the GA4 interface. Find your device and there you should see the video_start event. Click it and then expand the video_view parameter. Its value should be 1.
#3. Register custom metric in Google Analytics 4
Go to Google Analytics 4 > Custom Definitions > Custom Metrics > Create Custom Metrics.
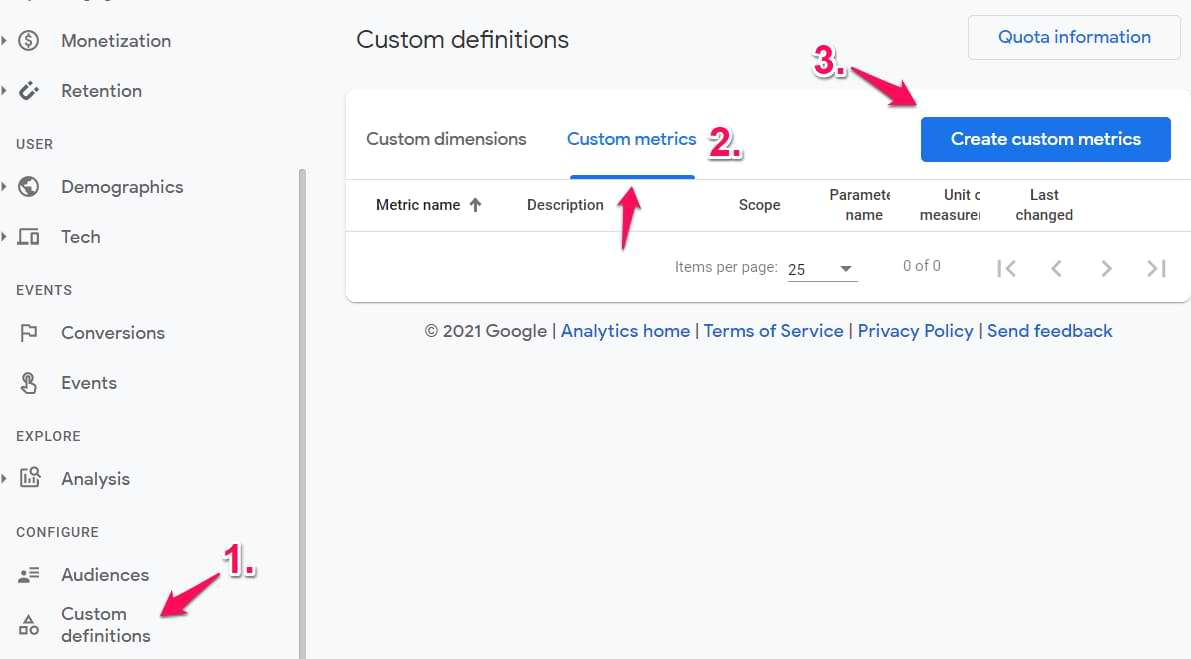
Then enter the following conditions:
- Metric name: Video views (can be named whatever you want)
- Scope: Event
- Description: This is optional, you can leave it empty
- Event parameter: video_view (enter it exactly as you configured it in the GA4 event tag in GTM)
- Unit of Measurement: Standard
Save the metric.

Standard unit of measurement means a regular integer.
In some cases, it might make sense to have the Currency as the unit of measurement. For example, you send the purchase event every time someone makes a purchase on your website. Together with that event, you also send parameters like value (e.g. 99.99) and coupon (e.g. SUMMER20). But together with that event, you could also send the size of the discount (e.g. 20.00). To do that, you could send a custom parameter discount_value and then register it as a currency custom dimension.
There are also other units of measurement like feet, miles, seconds, etc.
#4. Publish changes in your Google Tag Manager container
Don’t forget to publish your changes so that this change would go live to all of your visitors/users. Click the Publish button at the top-right corner and follow all the steps.
After you do it, wait till the next day and the metric will be ready to use. In total, it might take up to 24 hours. So don’t start worrying too soon.
Using Custom Metrics in Google Analytics 4
Here is an example of where you can see/use that Video Views custom metric in Google Analytics 4.
Go to Analysis > Analysis Hub > Exploration.

Then enter the following configuration.
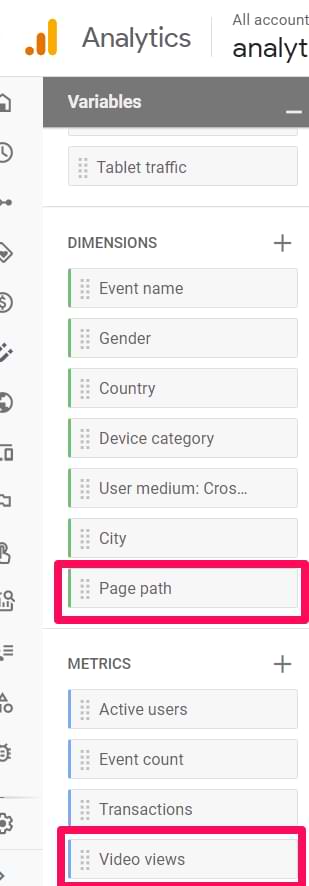
Variables tab:
- Add Page path as a dimension
- Add Video Views as a metric
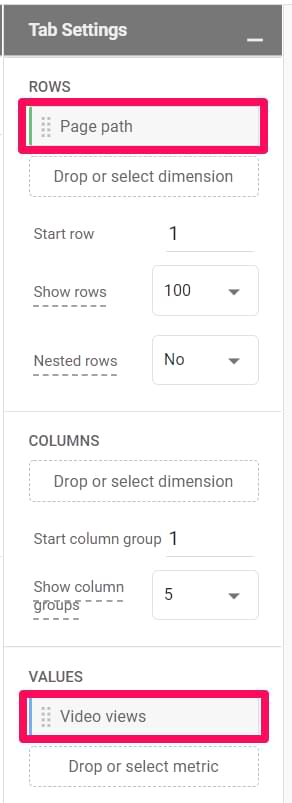
Tab Settings tab:
- Add Page path in the Rows section. Remove any dimension that was prefilled there.
- Add Video Views in the Values section. Remove any other metrics that are there
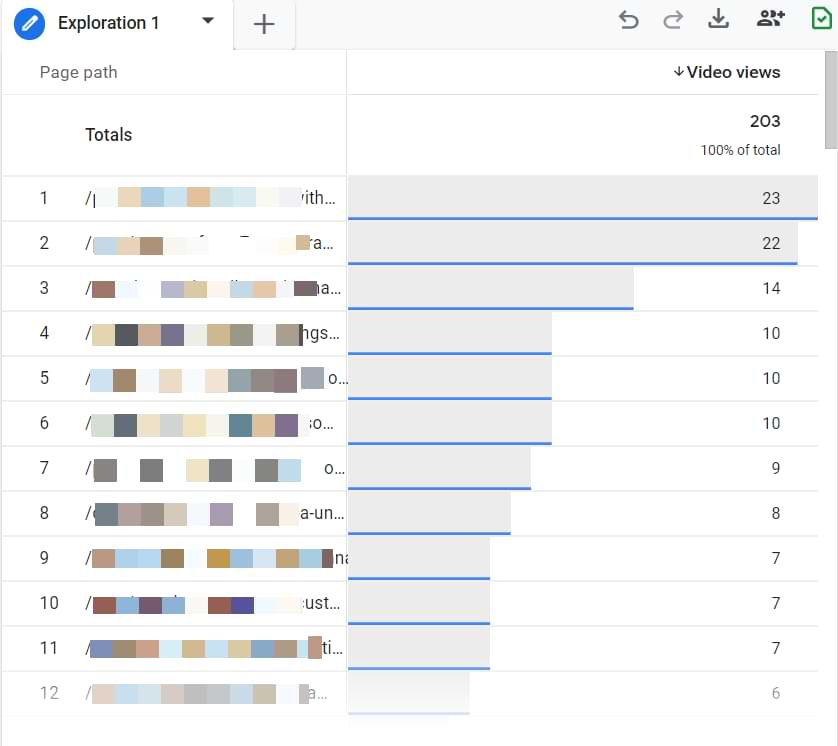
And then you will see a report that looks like this. On these pages, there is an embedded youtube video player embedded and I can see how often those videos are played.
In fact, I could go even further and create another metric for page views and have it in the same report. Although, it would be nice that such a basic thing as the Page Views metric would be available by default.
If you want to learn more about how to use the Exploration report, read/watch this.
Custom Metrics in Google Analytics 4: Final words
And here we have reached the end of this fairly basic overview of custom metrics in Google Analytics 4. We have learned that:
- Metrics are quantitative measurements and they let us count/measure (while dimensions describe items, users, products, pages, etc.)
- You can send custom metrics to Google Analytics 4 by including them in GA4 tags (within GTM).
- You have to register custom metrics in Google Analytics 4 if you want to use them in reports