Compared to Universal Analytics, Google Analytics 4 offers more built-in tracking capabilities. This includes file downloads, outbound clicks, scroll tracking, and more. But did you know that the built-in scroll tracking in Google Analytics 4 tracks only when someone scrolls below the 90% percent mark of the page height?
What if you want to track other thresholds as well (e.g. 25%, 50%, 75%)? Maybe in the future, that will also become built-in, but as of the moment of writing this blog post, it’s either 90% or nothing.
In this blog post, I wanted to show you how to implement scroll tracking with Google Analytics 4 and Google Tag Manager. There are two possible approaches here and I’ll explain them both.
Also, I’ll show several examples of the Analysis Hub report where you can see your scroll data.
Table of Contents
- Two Approaches
- Disable automatic scroll tracking in GA4
- Configure a Scroll Trigger
- Enable Scroll Variable(s)
- Configure the GA4 event tag
- Test Everything and Publish
- Scroll tracking reports in Google Analytics 4
- Final words
Two Approaches
You have probably heard that Google Analytics 4 has a much more flexible data model than its predecessors. But with great flexibility comes greater responsibility. Thus you have to decide beforehand, how are you going to name and structure your scroll events. There are mainly two approaches:
- One event name scroll with the parameter percent_scrolled (this approach is based on what Enhanced Measurement is tracking)
- Unique event name for every scroll threshold, e.g. scroll_25, scroll_50, scroll_75, scroll_90 (or any other similar taxonomy). In this case, there is no need to have the percent_scrolled parameter because we can already see it in the list of events.
Which one should you choose? The answer is classic it depends:
The first approach (event name scroll + percent_scrolled parameter) requires registering a custom dimension to see it in the reports (and you can have up to 50 custom dimensions per GA4 property). And if you are close to reaching the limit, this option might not be right for you.
I really hope that one day, percent_scrolled will become a built-in dimension (and if you are reading this in the future when this parameter is indeed available as a built-in dimension, please let me know in the comments. I’ll update the guide).
The second approach (unique event name for each scroll threshold). Currently, there is a limit of 500 events per app instance (whatever that means). So I presume that is “per device”. If you are very intense/heavy with your GA4 tracking and you track a bunch of distinct events, you might eventually reach that limit. So if that’s your case, adding additional 4 (or more) events might not be an option.
Although personally, I’d say that not so many businesses should reach that 500-event-limit.
So it’s up to you to decide which option to choose.
- It’s either one event + 1 custom dimension
- Or 4 (or more) distinct event names
Now, let’s move to the actual configuration.
Disable automatic scroll tracking in GA4
Since we are going to configure our own scroll tracking in Google Analytics 4, there is no need to keep the native one enabled. We are taking over the control!
In Google Analytics, go to Admin > Data Streams > Select your web data stream. Then click the Gear Icon…

…and disable Scroll tracking. Click Save.

Configure a Scroll Trigger
Even though Google Tag Manager has scroll tracking capabilities, they are disabled by default.
Go to Google Tag Manager > Triggers > New > Scroll Depth and enter the following settings:

If you want, you can change the percentages or apply other tweaks. The configuration you see above is the most common one.
Save the trigger.
Enable Scroll Variable(s)
Even though we need just one scroll variable in this setup, you can enable all of them in the container (there won’t be any significant negative impact on your page performance). Go to Variables > Configure (in the Built-in variables section) and enable all scroll-related variables:

Configure the GA4 event tag
Now, it’s time to configure the GA4 event tag that will send the scroll event. In this part, I presume that you already know some GA4 basics and have installed the GA4 configuration tag in GTM. If you are just starting, take a look at this tutorial.
Once you have the GA4 configuration tag installed in Google Tag Manager, it’s time for you to choose which approach are you going to implement:
- One event scroll with the parameter percent_scrolled?
- Multiple scroll event names (one for each threshold) and no custom scroll-related parameters
If you are not sure which one to choose, feel free to re-read this chapter.
Option #1: One scroll event with a parameter
In Google Tag Manager, go to Tags > New > GA4 Event and enter the following settings:

Here, we are following the naming convention of Enhanced Measurement. Every time a visitor passes a certain scroll threshold (that is configured in your scroll trigger), this event tag will fire, and together with the scroll event, you’ll also send the percent_scrolled custom parameter.
If you want to use/see this parameter in your GA4 reports, you also must go to Custom Definitions (that’s on the left sidebar of the Google Analytics 4 interface), click Create Custom Dimension, and enter the following settings:

Save this dimension.
Once you start sending scroll events, you will start seeing them in your reports within 24 hours + you will be able to use/see the Percent Scrolled custom dimension. If you see some changes in the interface, please let me know in the comments and I’ll update the guide.
Option #2: Multiple event names (one for each scroll threshold)
If you decided to go with this approach, go to Tags > New > GA4 Event and enter the following settings (that’s in Google Tag Manager):

Here, we are using the same Scroll Depth Threshold variable, but this time, it’s inserted in the event name. So if a visitor scrolls past the 25% threshold, the event’s name will be scroll_25, if it’s 50% — scroll_50, etc.
In this case, you don’t need to create any custom dimensions.
Test Everything and Publish
Now, let’s test everything. In Google Tag Manager click the Preview button in the top-right corner. Then enter the URL of your website where you are going to test the scroll tracking and click Start.

After you are redirected to your website, scroll down (at least below 50% threshold).
Then go back to the Preview mode (make sure you are checking your current container).
And you should see at least two Scroll Depth events in the preview mode. Click any of them and check if your GA4 event tag fired. Then check another one:

You can also click on a tag, then switch to Values, and see what kind of data was sent to Google Analytics.

And now, we have to check whether the data was actually received by GA4. In Google Analytics, go to DebugView. It’s at the bottom of the left sidebar. If there is more than one device, you’ll have to find yours (in the top-left corner of the DebugView).

How can you know which one is yours? Well, one of them should be sending scroll events. Maybe that will help to distinguish.
If everything is configured correctly, you should start seeing either scroll or scroll_xx events. You can click them and check what other parameters were sent as well.
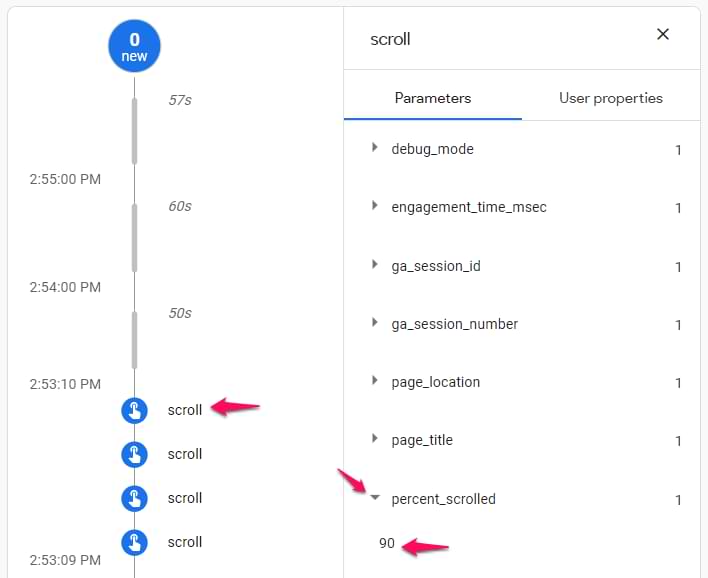
In the screenshot below, you will see what the event should look like by following the first approach.
If everything is good, go to Google Tag Manager, click SUBMIT in the top-right corner, and then PUBLISH.
Scroll tracking reports in Google Analytics 4
Once you start tracking scroll in Google Analytics 4, you will need to wait for up to 24 hours to see the data in regular reports.
You will see the new scroll event(s) in the Events list (on the left sidebar)

If you click that event, you will see several additional charts about it.
If you want to see scroll data on a particular page of your website, you can go to Analysis > Analysis Hub > Exploration report and do some additional configuration.
Configuration #1a: If you use one scroll event name + you want to analyze scrolling on one page
In the Variables column of the Analysis Hub, click the plus icon next to Dimensions.

- Find and add the Percent Scrolled dimension (remember: you might need up to 24 hours to start seeing that dimension in the list).
- Also, add the Page Path dimension
Then in the Tab Settings column, add the Percent Scrolled dimension in the Rows section.
Leave nothing in the Columns section.
In the Values section, add Active Users and Event Count.

In the Filters section, add two filters:
- Event name exactly matches scroll
- And if you want to narrow down to a particular page, you can enter another filter with Page Path contains xxxxx (for example, /pages/contact-us/). Remember, Page Path does not contain a domain. You can see the examples of Page Paths in your GA4 > Engagement > Pages and Screens (and then switch to the Page Path and Screen Class above the table).

Then the report might look something like this:

In this report, you can see how many people on a particular page reached certain scroll thresholds.
Configuration #1b: If you use one scroll event name + analyze multiple pages
This is an alternative variation of the previous configuration. In #1a example, we narrowed it down just to a single page. In this example, we will see multiple pages in the same table.
In the Variables column of the Analysis Hub, click the plus icon next to Dimensions.
- Find and add the Percent Scrolled dimension (remember: you might need up to 24 hours to start seeing that dimension in the list).
- Also, add the Page Path dimension
Then in the Tab Settings column, add the Page Path dimension in the Rows section. Select to show 25 rows (or even more).
Add Percent Scrolled custom dimension in the Columns section
In the Values section, add Event Count.

In the Filters section, add the following filters:
- Event name exactly matches scroll
- Percent Scrolled does not exactly match (not set) (if this is bothering you and there aren’t many events that meet this criterion. Otherwise, you should identify and fix the “not set” problem.).

Then the report might look something like this:

As of the moment of recording this video, it looks like you can sort data only by the Totals column. Hopefully, that will change in the future.
Configuration #2a: If you use multiple scroll event names + analyze one page
If you decided to go with distinct events for each scroll threshold (e.g. scroll_25, scroll_50, etc.), then here’s a sample report that you could create for a particular page.
In the Variables column of the Analysis Hub, click the plus icon next to Dimensions. Find and add the Page Path dimension and Apply it.
Then in the Tab Settings column, add the Event Name dimension in the Rows section.
Leave nothing in the Columns section.
In the Values section, add Active Users and Event Count.

In the Filters section, add the following filters:
- Event name contains scroll (if your event names are scroll_25, scroll_50, etc.). That way, we will match all scroll events regardless of the full event name.
- And if you want to narrow down to a particular page, you can enter another filter with Page Path contains xxxxx (for example, /pages/contact-us/). Remember, Page Path does not contain a domain. You can see the examples of Page Paths in your GA4 > Engagement > Pages and Screens (and then switch to the Page Path and Screen Class above the table). See configuration #1a in this blog post for more details.
Then the report might look something like this:

Here we see how many users have scrolled past 25%, 50%, and other thresholds on a particular page of the website.
Configuration #2b: If you use multiple scroll event names + analyze multiple pages
This is an alternative variation of the previous configuration. In #2a example, we narrowed it down just to a single page. In this example, we will see multiple pages in the same table.
In the Variables column of the Analysis Hub, click the plus icon next to Dimensions. Find and add the Page Path dimension and Apply it.
Then in the Tab Settings column, add the Page Path dimension in the Rows section. Select to show 25 rows (or even more).
Add Event name dimension in the Columns section
In the Values section, add Event Count.

In the Filters section, add the following filter: Event name contains scroll.

Then the report might look something like this:

Here you can see your “most scrolled” pages and how the drop-off changes on each threshold.
Scroll Tracking with Google Analytics 4: Final words
And that’s the end of yet another Google Analytics 4 blog post here, on Analytics Mania. There are mainly two approaches you can choose from if you decide to customize scroll tracking:
- Track a single event with an additional parameter for scroll thresholds
- Or not use any parameters but instead, include the threshold in the event name
Both options have their pros and cons. In the beginning, I was more using the “single event name” approach but with the limited number of custom dimensions (and having percent_scrolled counted towards that limit as well), the 2nd approach becomes more and more appealing.
I hope that one day, percent_scrolled will be available as a dimension by default. Because, after all, it is a parameter that’s automatically tracked by Enhanced Measurement as well.